
Description
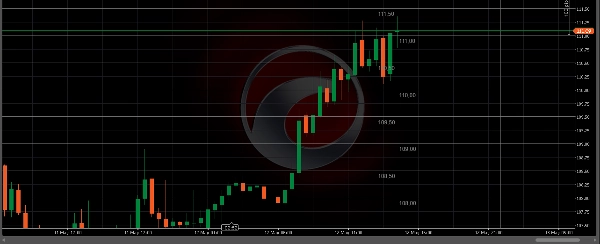
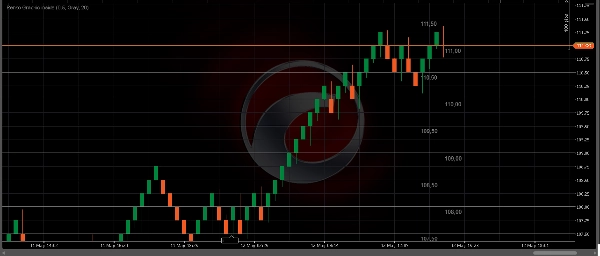
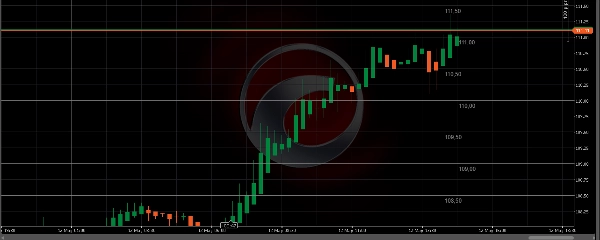
This custom indicator draws configurable horizontal grid lines on any chart type (Renko, Candlestick, Line, Tick, Range, Volume, Point & Figure, and Kagi). It helps traders visualize higher timeframe brick levels directly on their lower timeframe chart, supporting multi-timeframe analysis without switching between windows.
KEY FEATURES:
- Works with ALL chart types (Renko, Candles, Line, Tick, Range, Volume, PnF, Kagi)
- Configurable grid spacing (from 0.1 points upward)
- Adjustable number of grid lines (4 to 50)
- Customizable line colors for better visibility
- Automatic price level labels for quick reference
TRADING USE CASES:
- Identify support and resistance levels
- Perform multi-timeframe analysis on a single chart
- Visualize "higher brick" boundaries on lower Renko charts
- Spot key price zones for entries and exits
TECHNICAL DETAILS:
- Indicator type: Visual overlay / Grid lines
- Works on: All timeframes (the grid spacing is price-based, not time-based)
- Compatible with: Forex, Indices, Commodities, Crypto, Stocks
⚠️ DISCLAIMER: Trading involves risk of loss. Past performance does not guarantee future results. This indicator is a visual tool and does not generate trading signals. Always use proper risk management.
📌 YOU MAY ALSO LIKE:
Check out my other professional indicators available on the cTrader Store:
🔵 Signal Quality Score - 0-100 score to filter your entries (RSI, Volume, ATR, Trend) - View Product
🟢 Market Regime Detector - Identifies TRENDING, RANGING and VOLATILE markets with pullback detection - View Product
🟠 Session Kill Zone Highlighter - Visualizes London, NY, Tokyo, Sydney sessions and ICT Kill Zones - View Product
⚙️ Smart Auto Scroll Center - Keeps price centered on your chart with manual zoom control - View Product
Visit my profile to see all products: CapitalMente on cTrader Store
SUPPORT:
For questions or feature requests, contact me through the cTrader Store.
HOW TO USE:
Simply attach the indicator to any chart and adjust the "Higher Renko Size" parameter to set the grid spacing. The number of lines and colors are fully customizable.
Summary
Key features include adjustable grid spacing starting from 0.1 points, a customizable number of grid lines ranging from 4 to 50, and selectable line colors for enhanced visibility. The indicator automatically labels price levels for quick reference.
This tool supports various markets such as Forex, Indices, Commodities, Crypto, and Stocks, and works across all timeframes since the grid spacing is price-based rather than time-based. It is primarily used to identify support and resistance levels, visualize higher brick boundaries on lower Renko charts, and highlight key price zones for trade entries and exits.
To use, attach the indicator to any chart and set the "Higher Renko Size" parameter to define grid spacing. The number of lines and their colors can be fully customized to suit individual preferences. This indicator serves as a visual aid and does not generate trading signals.
Customer reviews
5 | 100 % | |
4 | 0 % | |
3 | 0 % | |
2 | 0 % | |
1 | 0 % |