
AllPattern
Indicator
362 downloads
Version 1.0, Aug 2025
Windows, Mac
5.0
Reviews: 2
Description
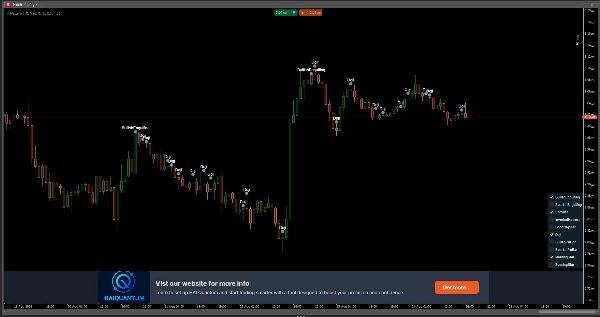
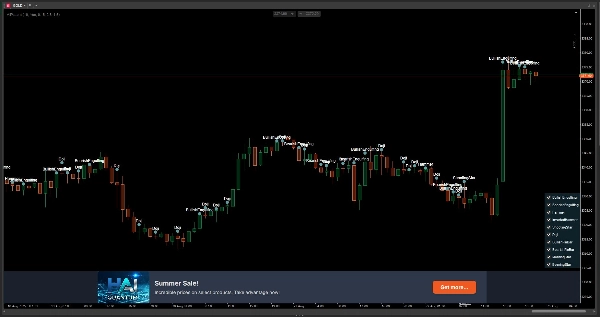
🔍 Discover All Candlestick Patterns… Absolutely Free! 😀
With our tool, you can visualize all major candlestick patterns directly on your chart. From Doji to Bullish Engulfing, including Hammer, Shooting Star, and many more.
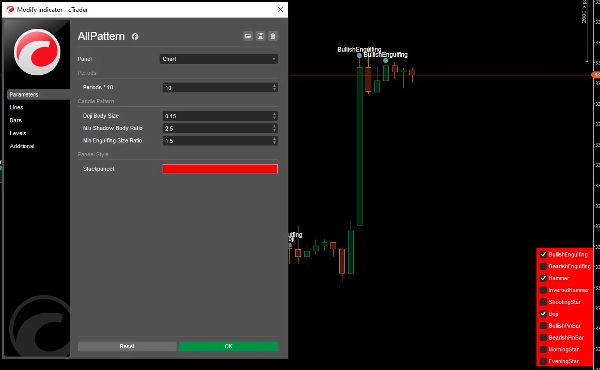
📌 How does it work? It’s simple: use the panel on the right to choose exactly which patterns you want to display. Toggle them on or off to match your trading strategy.
💸 Best part? It’s completely free! No subscriptions, no limits—just pure, visual analysis.
Summary
Indicator profile
Customer reviews
5.0
Reviews: 2
5 | 100 % | |
4 | 0 % | |
3 | 0 % | |
2 | 0 % | |
1 | 0 % |
Customer reviews
October 8, 2025
Chart artist’s dream! 🧠 Spots triangles, wedges, flags — all in one go. Saves tons of time on manual pattern drawing. Great helper, but always double-check those breakouts!
Discussion
FAQ
BTCUSD
Forex
Signal
Breakout
Indices
EURUSD
Commodities
GBPUSD
NZDUSD
Martingale
Prop
Scalping
Crypto
Grid
Stocks
AI
XAUUSD
NAS100
USDJPY
Products available through cTrader Store, including trading bots, indicators and plugins, are provided by third-party developers and made available for informational and technical access purposes only. cTrader Store is not a broker and does not provide investment advice, personal recommendations or any guarantee of future performance.


Price
147
Sales
11.17K
Free installs