present
Sign up and get $50 off your first purchase
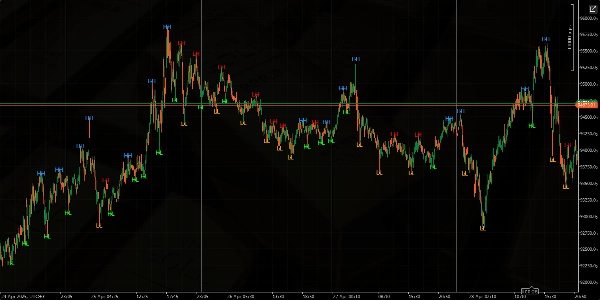
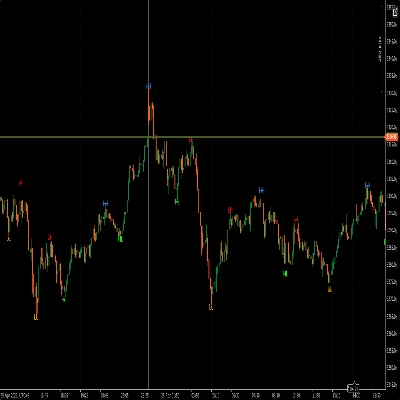
Trading product for Higher Highs Lower Lows Indicator, image 1
Higher Highs Lower Lows
Indicator
47 downloads
Version 1.0, Apr 2025
Windows, Mac
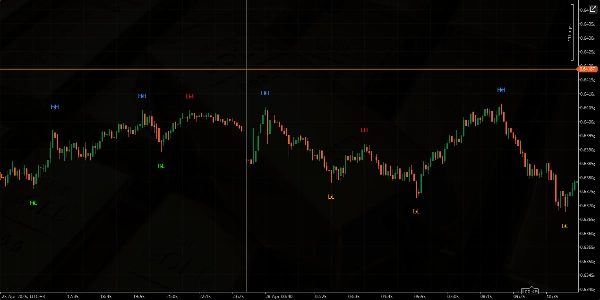
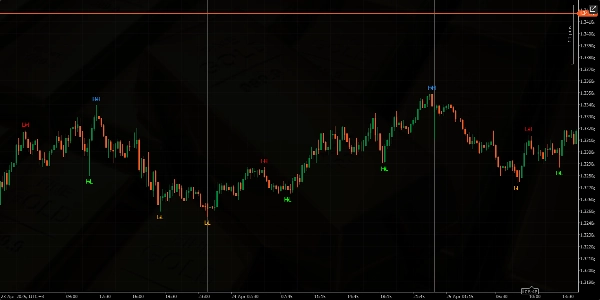
Trading product for Higher Highs Lower Lows Indicator, image 2
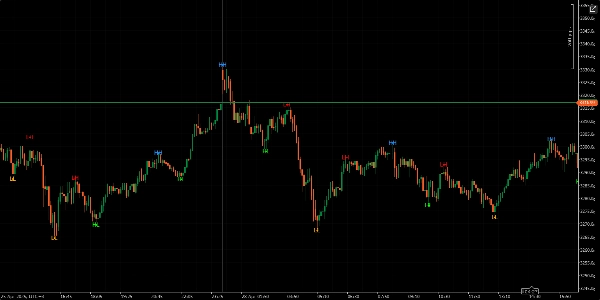
Trading product for Higher Highs Lower Lows Indicator, image 3
Trading product for Higher Highs Lower Lows Indicator, image 4
Trading product for Higher Highs Lower Lows Indicator, image 5
Since 16/03/2025
256
Free installs

Description

Summary

AI summary
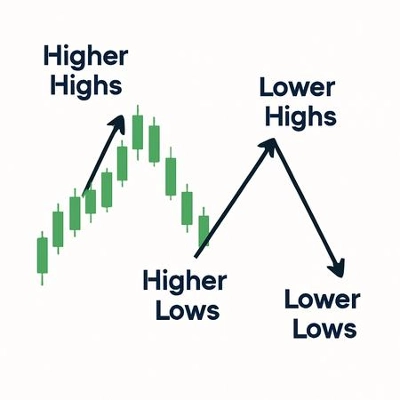
Higher Highs Lower Lows is a technical indicator designed to automatically detect and mark key market structure points on trading charts. It identifies and highlights higher highs, lower highs, higher lows, and lower lows, which are fundamental elements in analyzing price trends and market momentum. This indicator assists traders by visually marking these critical price levels, facilitating the assessment of market direction and potential trend reversals. It can be applied across various markets and timeframes to support technical analysis. Installation of the indicator enables automatic market structure recognition without manual plotting.
Indicator profile

Customer reviews

0.0
Reviews: 0
Customer reviews
No reviews for this product yet. Already tried it? Be the first to tell others!

Discussion

FAQ

Products available through cTrader Store, including trading bots, indicators and plugins, are provided by third-party developers and made available for informational and technical access purposes only. cTrader Store is not a broker and does not provide investment advice, personal recommendations or any guarantee of future performance.

More from this author
Indicator
ATR
RSI
+8
The WaveTrend Indicator is a multifunctional oscillator designed to center the trend wave or movements in the trend.

You may also like

Indicator
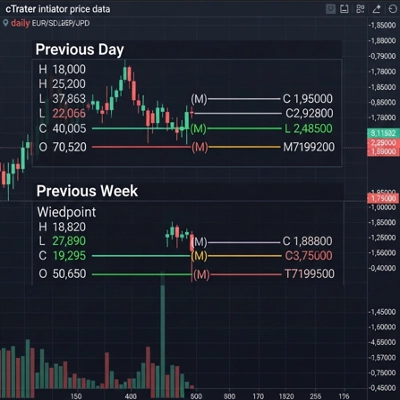
The Weekly Daily Levels indicator shows the OHLC, and mid-point prices for the previous day and week.
Indicator
The Structure Fractal indicator is designed to identify and visualize key market structure points
Indicator
SMC
Prop
+14
FVG Multi Time Frame Indicator
Indicator
MSS
Volume
+3
Rejection-based volume profile with tiered heat zones, POC levels and a fully draggable anchor on cTrader.
Indicator
Laser entries with pivot confirmation. No repaint, all timeframes. Professional results.
Indicator
ATR
Prop
+14
Optimize exits with Chandelier Exit! Visualize stop-loss points dynamically for improved trading precision and safety.
Indicator
Doji
Transform Your Charts Instantly with 20+ Professionally Designed Themes
Indicator
ADX
ATR
+5
Configure, simulate, and analyze trading strategies with custom filters, multi-target exits, and detailed performance me
Indicator
Doji
Flag
+5
Angora Pattern Recognition is a cTrader indicator that finds, draws and tracks classic chart patterns automatically.
Indicator
ADX
ATR
+2
GOLD SENTINEL v1.0 - A CANDLE-COLORING INDICATOR FOR GOLD.
Indicator
Indices
this indicator shows previous day high low and closed with precise manner.
Indicator
BOS
Volume
+5
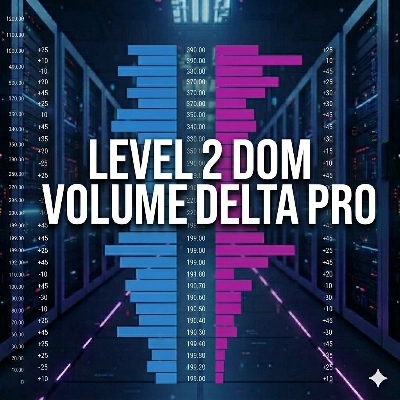
The Volume Delta Indicator using Institutional Level 2 DOM Data, The Edge Institutions Pay Millions For, now on cTrader
Indicator
AI
BOS
+4
Golden Boom and Crash Spike Detector is a trading tool designed for Crash 300 and Boom 300 indices on M1 Timeframe.
Indicator
Forex
Crypto
+5
This indicator combines two independent analytical engines into a single overlay on your chart.
Indicator
Drawdown Monitor
Protect your funded account. Real-time Daily Equity Drawdown monitor with Green / Orange / Red flashing alerts.
Indicator
AI
RSI
+7
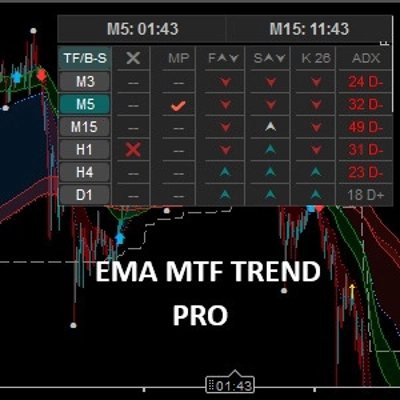
EMA MTF TREND PRO - Multi-timeframe trend analysis overlay indicator, 6 timeframes - in one table with ADX
Indicator
Prop
Forex
+10
Heatmap Pro analiza la volatilidad, el volumen y la acción del precio para "pintar" tu gráfico con zonas de color.
Indicator
ATR
Key Levels
It combines the trend-filtering power of Renko charts with the volatility tracking of ATR Bands

Price

Since 16/03/2025
256
Free installs