![Trading product for [Stellar Strategies] Visual Trend Momentum Indicator Signal Commodities, image 1](https://cdn.ctrader.com/image/webp/48aee0a5-f10e-4bc8-9671-78e156fcc5df_27548)
![Trading product for [Stellar Strategies] Visual Trend Momentum Indicator Signal Commodities, image 2](https://cdn.ctrader.com/image/webp/bf3e8d6e-4fe2-498f-9c94-fcc41b457306_27549)
![Trading product for [Stellar Strategies] Visual Trend Momentum Indicator Signal Commodities, image 3](https://cdn.ctrader.com/image/webp/606e7147-24a3-4137-b2c8-1245a4fbb93a_27550)
![Trading product for [Stellar Strategies] Visual Trend Momentum Indicator Signal Commodities, image 4](https://cdn.ctrader.com/image/webp/c6f6508a-0abf-4df2-a2ec-8954c481ec9e_27551)
![Trading product for [Stellar Strategies] Visual Trend Momentum Indicator Signal Commodities, image 5](https://cdn.ctrader.com/image/webp/f59e757b-aaa5-46aa-b41b-b5852db0a3ae_27552)
![Trading product for [Stellar Strategies] Visual Trend Momentum Indicator Signal Commodities, image 6](https://cdn.ctrader.com/image/webp/60e2a71a-ca6f-467f-a22f-fd4a31226ef6_27553)
Description
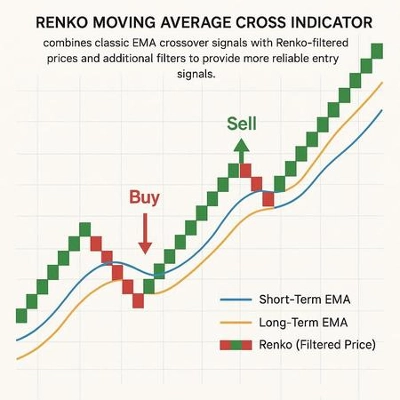
This cAlgo indicator, named VisualTrendMomentum, is designed to visually represent trend strength and momentum on a chart using a combination of moving averages (MAs), Average True Range (ATR), and volume analysis. It aims to provide traders with a clear visual indication of potential buy and sell signals, as well as trend changes, through colored diamond icons and arrows.
Key Features:
- Trend Detection:
- It uses three exponential moving averages (fast, medium, and slow) to determine the overall trend direction.
- It differentiates between "strong" and "weak" buy/sell signals based on the alignment of these MAs and the current bar's close and open prices.
- Volatility Analysis:
- It incorporates three ATR indicators (short, medium, and long) to measure market volatility.
- It uses volatility levels to filter and strengthen the buy/sell signals.
- Volume Confirmation:
- It analyzes tick volume to identify significant volume spikes, which can confirm trend strength.
- It uses a multiplier to set the level of significant volume.
- Trend Change Detection:
- It detects trend changes by comparing the current strong buy/sell state with the previous state.
- Trend changes are highlighted by an up or down arrow.
- Visual Representation:
- It displays buy/sell signals using colored diamond icons on the chart, with different colors indicating signal strength (strong vs. weak).
- Trend changes are displayed using up or down arrows.
- The color of the icons and arrows are customizable through the indicator's parameters.
- Customizable Parameters:
- The indicator allows users to customize the periods for the moving averages and ATRs, the volume multiplier, and the colors used for visualization.
How to Use the Indicator:
- Add the Indicator to cAlgo:
- Open a chart in cAlgo.
- Add the [Stellar Strategies]
VisualTrendMomentumindicator to the chart from the "Indicators" list.
- Configure the Parameters:
- Adjust the input parameters according to your trading style and the specific market you are analyzing.
Fast MA Period,Medium MA Period,Slow MA Period: Set the periods for the exponential moving averages.Short ATR Period,Medium ATR Period,Long ATR Period: Set the periods for the average true range indicators.Significant Volume Multiplier: Adjust the multiplier to define significant volume levels.Strong Buy Color,Strong Sell Color,Weak Buy Color,Weak Sell Color,Trend Change Color: Choose the colors for the different signal types.
- Interpret the Signals:
- Colored Diamonds:
- Dark Green Diamonds: Strong buy signals.
- Dark Red Diamonds: Strong sell signals.
- Olive Diamonds: Weak buy signals.
- Brown Diamonds: Weak sell signals.
- Arrows:
- Gold Up Arrow: Indication of a trend change from sell to buy.
- Gold Down Arrow: Indication of a trend change from buy to sell.
- Trend Strength:
- The combination of diamond icons and volume levels provides insight into the strength of the current trend. Higher volume with a strong buy/sell diamond strengthens the signal.
- Trading Decisions:
- Use the indicator's signals in conjunction with other technical analysis tools and your trading strategy.
- Consider the overall market context and risk management before making any trading decisions.
- Important notes:
- Because the indicator uses moving averages and ATR indicators, it is a lagging indicator.
- The indicator is most effective in trending markets.
- Adjust the parameters to fit the market conditions.
................................................................................................................................................................................................................
Trader Warning: Trading involves significant risk and is not suitable for every investor. You may lose some or all of your invested capital. Always ensure you fully understand the risks and seek independent financial advice if necessary. The Visual Trend Momentum indicator is a tool to assist in identifying trends and potential trading opportunities but does not guarantee profitable trades.
Summary
Trend changes are detected by comparing current and previous strong buy/sell states and are marked with up or down arrows. Buy and sell signals appear as colored diamond icons on the chart, with colors indicating signal strength (strong vs. weak). All visual elements’ colors and indicator parameters—including MA and ATR periods and volume multiplier—are customizable.
Users add the indicator to cAlgo charts, configure parameters to suit their trading style and market, and interpret signals alongside other analysis tools. The indicator is lagging by nature and is most effective in trending markets. It provides visual cues to assist in identifying trends and potential trading opportunities but does not guarantee profitable trades.
Customer reviews
5 | 100 % | |
4 | 0 % | |
3 | 0 % | |
2 | 0 % | |
1 | 0 % |
!["[Stellar Strategies] Market Structure Breakout" logo](https://cdn.ctrader.com/image/webp/bceec265-3247-4b11-915f-6295a29c106d_28465)
!["[Stellar Strategies] Market Session Ultimate" logo](https://cdn.ctrader.com/image/webp/61ffd537-0125-4246-9e72-42eca1791d64_28232)
!["[Stellar Strategies] BOS Trend 1.0" logo](https://cdn.ctrader.com/image/webp/6cdec0f1-0e97-4a82-a8a4-2b67aed54d38_25695)
!["[Stellar Strategies] Inside Bar with Signals" logo](https://cdn.ctrader.com/image/webp/1d9e8bfa-3b2c-4440-bb37-5856902008a7_30683)
!["[Stellar Strategies] Wave Trend Pro" logo](https://cdn.ctrader.com/image/webp/5f226fbb-245a-41cd-9cdd-b018257d5e6d_28617)
!["[Stellar Strategies] Smart ADX" logo](https://cdn.ctrader.com/image/webp/af13b084-b6f6-41db-b7bc-c7e688b57b05_36929)
!["[Stellar Strategies] Linear Regression Candles 1.1" logo](https://cdn.ctrader.com/image/webp/8b9cff9f-2431-46d2-b0ec-c7f55f4a4a6d_27918)
!["[Stellar Strategies] VBO" logo](https://cdn.ctrader.com/image/webp/f034c012-94d4-445a-a01b-febd1cdedaef_36944)
!["[StellarStrategies] Scheduled Trade Executor" logo](https://cdn.ctrader.com/image/webp/daefc6af-7eca-453e-878d-1b981be2c401_25646)
!["[Stellar Strategies] Candlestick Patterns Dashboard" logo](https://cdn.ctrader.com/image/webp/ae8691a5-4884-4553-9bcc-64e16ac82a30_38344)
!["[Stellar Strategies] SP500 Gap Closure cBot 1.0" logo](https://cdn.ctrader.com/image/webp/92c23fdc-4ad1-4e61-bdb5-c77f6ec8c539_27686)
!["[Stellar Strategies] QQE" logo](https://cdn.ctrader.com/image/webp/e702104a-874c-4b39-97dd-fb34518d1015_27712)