"Fibonacci Prediction Channel" logo
Indicator
301 downloads
Version 1.0, Sep 2025
Windows, Mac
"Fibonacci Prediction Channel" uploaded image
Since 03/10/2024
159
Sales
36.52K
Free installs

▁▂▃▄▅▆▇ █ 10,000+ traders (institutional + retail) █ ▇▆▅▄▃▂▁

  • Choose our TOP indicators in cTrader 🏆
  • ✨ Exclusive precision for superior results ✨
  • 📈 Our algorithms —with the highest-rated visuals 🎯—
  • have been successfully implemented in 2 quant funds

▁▂▃▄▅▆▇ █████████████████████████████ ▇▆▅▄▃▂▁

_______________________________________________

_______________________________________________

📌 Market Structure Indicators

·     ✅ AdvancedMarket Structure: Bos, Choch, SwinLevels, Order Blocks,  Market Structure& Liquidity Finder

⚖️   Premium Discount Zones

🧠 ICT MACRO THEORY

·     🔄 Dynamic Market StructureAnalysis of Turning Points

·     🧱 Order Block

·     ⚖️ Market Imbalance

·     ⛓️ BOS & CHOCH

·     🧠 ICT Power of 3

·     🌀 Market Polarity Zones

______________________________________________________________-

Store cBots :  🧠 Gold & BTC BreakoutSession Pivots 🧠

_______________________________________________

🔚 Smart Exit Systems

·     📍 Trailing Smart Algorithm

_______________________________________________

📐 ZigZag Indicators

·     🔍 ZigZag Price LiquidityProjection

·     🧭 S&R Structural ZigZag

·     ➖ ZigZag

·     🎯 Zig-Zag Extremity Tracker

_______________________________________________

🧱 Support & Resistance Indicators

·     🟩 SmartTrend Support &Resistance Lines

·     🧱 All Support and ResistanceLevels

_______________________________________________

📊 Trend & Channel Indicators

·     🔄 Auto-Trend Channel

·     📊 Supertrend

·     ⚡Momentum Trend Analyzer

·     🧠 Adaptive Trend Channel

·     💥 Channel Breakout System

·     🌈 Dynamic Trend Gradient

·     ⭐ PREMIUM SSL CHANNEL

·     🔁 Reactive Moving Average

_______________________________________________

💧 Volume & Liquidity Tools

·     🔥 Volume POC Heatmap

·     📉 Leverage Liquidation Map

·     🔍 Momentum Fair Value Gap

·     🕒 Fair Value Gap Sessions

_______________________________________________

Momentum & RSI Indicators

·     📈 RSI Trend Trigger

·     🚀 Dynamic Range Momentum

·     🔎 Multi-Level Candle BiasTracker

_______________________________________________

🔮 Prediction & Projection Tools

·     📐 Prediction Based on Linreg& ATR

·     📏 Fibonacci Linear RegressionMulti-timeframe

·     📈 Volume-Powered Market Flow Projector 

  📉 Fibonacci Pitchfan

______________________________________________________________________________________________________


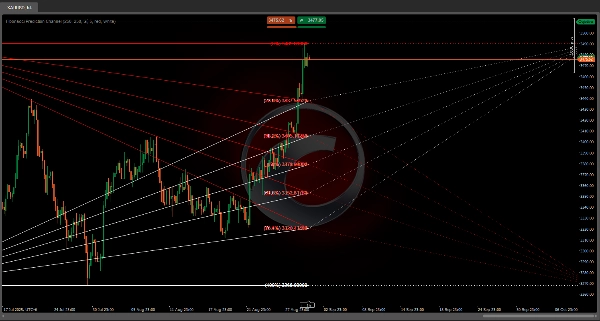
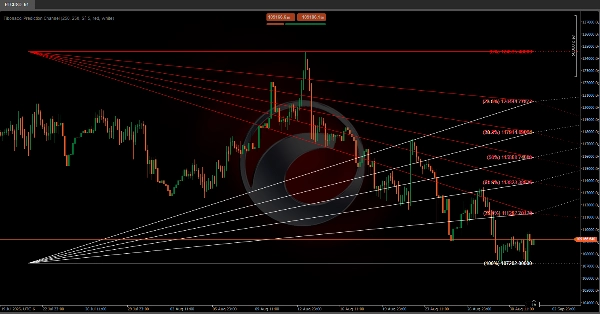
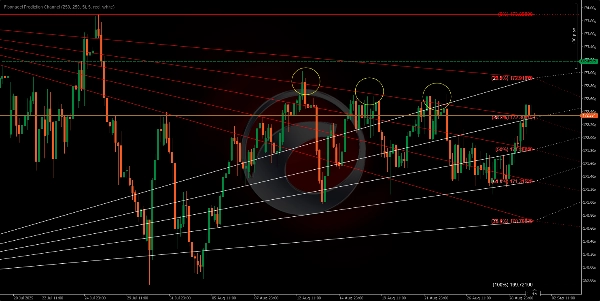
This algorithm is designed to plot a future prediction channel based on Fibonacci retracement levels 📊✨. The Fibonacci lines create a series of parallel channels between each pair of consecutive levels. These channels can be interpreted as ranges within which the price is expected to fluctuate 📈📉, generating a visual cone where the price will interact 🎯. If a level is broken ⚡, we will move to the next one.

These levels, which we project into the future, also act as support and resistance 🛡️⚔️, creating visual channels on the chart that can help us anticipate and plan actions 🧠✅ based on how the price has reacted to these levels in the past.


We can expect the price to react as it approaches these lines 🔍, potentially bouncing back within the channel 🔄 or, if there is enough momentum 🚀, breaking through the lines to move to the next channel.

The levels projected to the right ➡️🗓️ are not based on new price data but on past price action ⏳. They extend into the future as a kind of "map" 🗺️ for potential future price reactions.

Historical Bars ⏰: Determines how many past price periods will be considered when calculating the Fibonacci retracement levels.

Indicator profile
0.0
Reviews: 0
Customer reviews
No reviews for this product yet. Already tried it? Be the first to tell others!
Products available through cTrader Store, including trading bots, indicators and plugins, are provided by third-party developers and made available for informational and technical access purposes only. cTrader Store is not a broker and does not provide investment advice, personal recommendations or any guarantee of future performance.

More from this author

Indicator
ATR
RSI
+7
ZigZag filters noise, spots trends, patterns, pivots, aiding analysis, trade management, and confirmations. 📉📈
Indicator
ATR
RSI
+6
Market structural patterns , specifically the concepts of Change of Character (ChoCH) 🔄 and Break of Structure (BoS) 💥
Indicator
ATR
RSI
+7
📊 Shows volume by price levels, highlights POC, and key zones. Identifies dynamic support/resistance and imbalances.
Indicator
ATR
RSI
+7
Identify bullish and bearish Order Blocks to spot key support/resistance levels and potential trend reversals! 📈🔄
Indicator
ATR
RSI
+6
Adaptive trend channel using linear regression and Pearson correlation for dynamic support, resistance, and trends.
Indicator
RSI
Breakout
+1
"Identify key market zones and visualize support/resistance from multiple timeframes on a single chart.
Indicator
ATR
RSI
+7
identify and highlight temporary market inefficiencies known as "fair value gaps" 🚨 within specific trading Sessions.
Indicator
ATR
RSI
+6
💹 Define a price channel 📈 and determine trend direction (bullish 🟢 or bearish 🔴).
Indicator
ATR
RSI
+6
📊Zones Supply & Demand: Identifies key price levels with high volume concentration, marking Supply/Demand Zones & Marke
Indicator
RSI
BTCUSD
+5
Identify market structure effortlessly with swing highs, lows, CHoCH, and BOS levels for smart trading decisions! 📊🔍"
Indicator
ATR
RSI
+8
Detects bullish and bearish divergences
Indicator
Advanced price action tool that combines multiple technical analysis concepts

You may also like

Indicator
VWAP
Volume for Renko/Range
Indicator
[Stellar Strategies] BOS Trend: Premium multi-timeframe BOS indicator for precision trend analysis.📈📉
Indicator
Stochastic RSI Indicator
Indicator
Key Levels
Professional Market Profile
Indicator
Clean trend indicator using CCI & ATR. Highlights up/down trends with adaptive, no-repaint lines.
Indicator
SMC
VWAP
+16
It calculates Anchored VWAP and StdDev bands from a user-defined start date for cTrader charts.
Indicator
ATR
Forex
+5
Most used candle patterns. (1 candle, 2 candles and 3 candles patterns) and Marubozu. Bonus Fibo Risk control.
Indicator
The Multi-Timeframe Candle Indicator displays candles from multiple timeframes in one window, enhancing market analysis!
Indicator
XAUUSD
Commodities
A Fair Value Gap (FVG) indicator that identifies potential price imbalances, potential reversal and continuation zones
Indicator
BOS
CHOCH
+4
Dual-track market structure detection with BVC order flow confirmation and two-stage liquidity sweep validation.
Indicator
ZigZag Pro – Multi-Swing Indicator for cTrader Description: ZigZag Pro is a powerful and fully customizable swing indica
Indicator
ADX
ATR
+5
Precision Sniper by PrimeQuant: Advanced confluence engine with auto-presets, dynamic TP/SL, and live backtest stats.
Indicator
ATR
Prop
+13
Enhance trading with ATR Bands! Visualize market volatility using dynamic upper and lower ATR bands for precise decision
Indicator
ATR
RSI
+3
🚀 Specialized algorithm is designed to confirm entry and exit points with precision 🎯
Indicator
Forex
BTCUSD
+4
🚀 HALF TREND Indicator - The Ultimate Trend Following System 🚀
Indicator
VWAP
Volume
+4
Volume Profile + VWAP with Standard Deviations
Indicator
Prop
VWAP
+13
Rolling VWAP with dynamic or fixed time window, customizable source price and standard deviation bands.
Indicator
Liquidity Grab
Liquidity Sweep
+1
CRT Sweep Tracker is an advanced panel for Candle Range Theory (CRT) traders to track HTF sweeps and manage live trades.
Since 03/10/2024
159
Sales
36.52K
Free installs