ICT MACRO THEORY
"ICT MACRO THEORY" logo
13/08/2025
82
Desktop
Since 03/10/2024
Sales
105
Free installs
16162

🚀 10,000+ traders already use our TOP indicators🏆

Discover why professionals choose us – the most powerful tools on cTrader (indicators, algorithms, and cBots) are waiting for you.

👉 Get all our TOP systems here:

_______________________________________________

_______________________________________________

📌 Market Structure Indicators

·     ✅ AdvancedMarket Structure: Bos, Choch, SwinLevels, Order Blocks,  Market Structure& Liquidity Finder

·     🔄 Dynamic Market StructureAnalysis of Turning Points

·     🧱 Order Block

·     ⚖️ Market Imbalance

·     ⛓️ BOS & CHOCH

·     🧠 ICT Power of 3

·     🌀 Market Polarity Zones

______________________________________________________________-

Store cBots :  🧠 Gold & BTC BreakoutSession Pivots 🧠

_______________________________________________

🔚 Smart Exit Systems

·     📍 Trailing Smart Algorithm

_______________________________________________

📐 ZigZag Indicators

·     🔍 ZigZag Price LiquidityProjection

·     🧭 S&R Structural ZigZag

·     ➖ ZigZag

·     🎯 Zig-Zag Extremity Tracker

_______________________________________________

🧱 Support & Resistance Indicators

·     🟩 SmartTrend Support &Resistance Lines

·     🧱 All Support and ResistanceLevels

_______________________________________________

📊 Trend & Channel Indicators

·     🔄 Auto-Trend Channel

·     📊 Supertrend

·     ⚡Momentum Trend Analyzer

·     🧠 Adaptive Trend Channel

·     💥 Channel Breakout System

·     🌈 Dynamic Trend Gradient

·     ⭐ PREMIUM SSL CHANNEL

·     🔁 Reactive Moving Average

_______________________________________________

💧 Volume & Liquidity Tools

·     🔥 Volume POC Heatmap

·     📉 Leverage Liquidation Map

·     🔍 Momentum Fair Value Gap

·     🕒 Fair Value Gap Sessions

_______________________________________________

Momentum & RSI Indicators

·     📈 RSI Trend Trigger

·     🚀 Dynamic Range Momentum

·     🔎 Multi-Level Candle BiasTracker

_______________________________________________

🔮 Prediction & Projection Tools

·     📐 Prediction Based on Linreg& ATR

·     📏 Fibonacci Linear RegressionMulti-timeframe

·     📈 Volume-Powered Market Flow Projector 
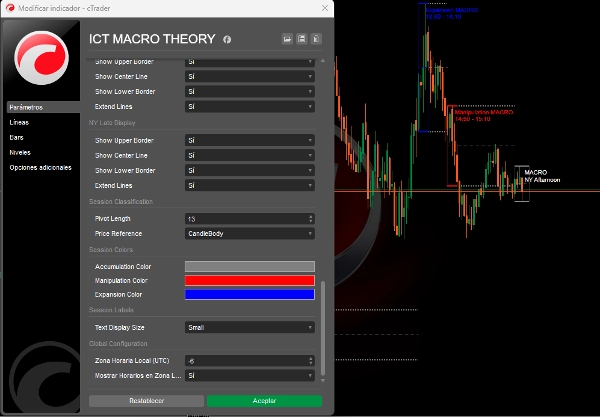
  📉 Fibonacci Pitchfan

_________________________________________________________________________________

_________________________________________________________________________________


🌐 ICT MACRO THEORY

⚠️ IMPORTANT NOTE: This indicator only works on timeframes below 5 minutes.

Explanation of ICT Macro Periods

ICT macro periods are essentially short intervals during which the algorithm seeks liquidity or adjusts price for fair value gaps. The foundation of these ICT macros lies in ICT's time and price theory.

A macro is "a short series of instructions that creates an event in price delivery", as defined by ICT itself.

ICT macros are not complete trading strategies, but they can add confluence to your trades and maximize profits. They occur during the London, New York, midday, and afternoon sessions.


🔮 Advanced Implementation of ICT Macro Times Theory:

Direct Connection to ICT Concepts:
The code implements exactly the 3 types of ICT macros described in the theory, using classification logic based on:

  1. Market Structure Analysis:
    • Detection of Macro Sessions
    • Records exact ICT times (London 02:33, NY 09:50, etc.).
    • Detects structural changes before and during each macro session.
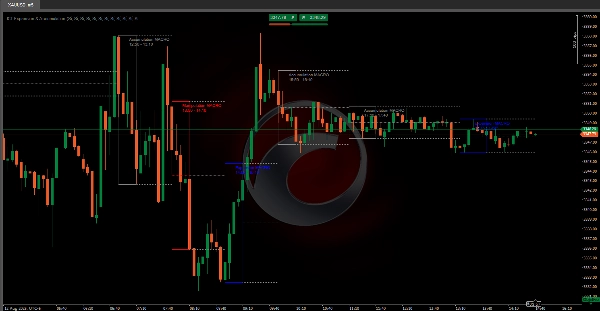
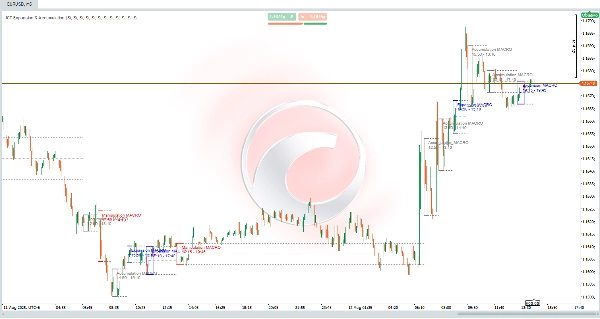
    • Automatically classifies into:
      • 🟥 Manipulation: When price sweeps liquidity on both sides (buy/sell).
      • 🟦 Expansion: Directional movements taking liquidity on one side (aligned with trend).
      • 🟩 Accumulation: Tight range where price "accumulates" liquidity.
  2. Extended Key Levels:
    • Draws highs/lows of each macro session.
    • Calculates and extends the average price (midpoint) to the next session.
    • These levels act as dynamic support/resistance (Essential in ICT!).
  3. Real-Time Liquidity Detection:
    • Uses 1-minute data to identify exact pivots (same as seen on lower timeframes).


Upcoming Enhancements & Updates:

  • Liquidity Sweeps Detection: Will identify previous liquidity sweeps (previous day/week highs/lows).
  • Fair Value Gaps (FVG): Will detect and visualize fair value gaps.


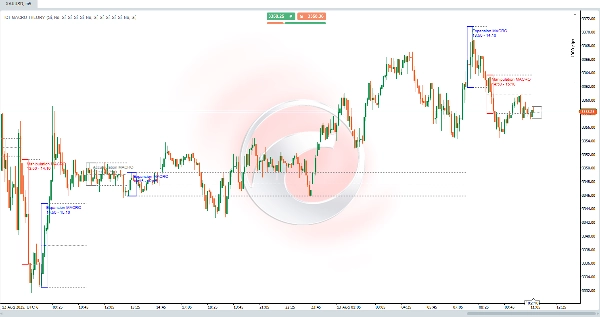
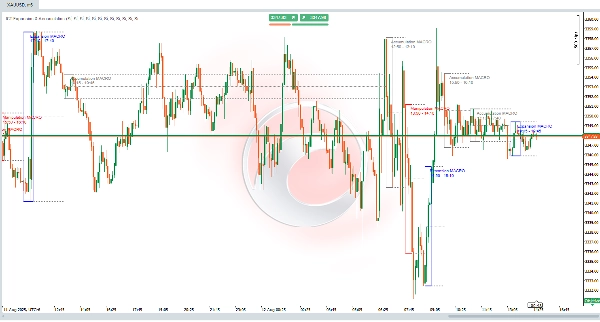
📊 Practical ICT Example
NY Opening Scenario (09:50-10:10):

  1. Pre-session: Price sweeps buy-side liquidity (local low).
  2. During session:
    • Classified as 🟥 MANIPULATION.
    • Price shifts to bearish structure.
  3. Post-session:
    • Extended lines mark resistance at session highs.
    • Trade rejection at zone with RR 1:3.

✅ Faithful to ICT Principle:
"Macros are not complete strategies but add confluence by identifying where algorithms will seek liquidity."


0.0
Reviews: 0
Customer reviews
No reviews for this product yet. Already tried it? Be the first to tell others!
More from this author
Indicator
RSI
Breakout
XAUUSD
+6
ZigZag
ZigZag filters noise, spots trends, patterns, pivots, aiding analysis, trade management, and confirmations. 📉📈
Indicator
RSI
Breakout
XAUUSD
+6
Order Block
Identify bullish and bearish Order Blocks to spot key support/resistance levels and potential trend reversals! 📈🔄
Indicator
RSI
Breakout
XAUUSD
+5
Auto-Trend Channel
Adaptive trend channel using linear regression and Pearson correlation for dynamic support, resistance, and trends.
Indicator
RSI
XAUUSD
Breakout
+5
BOS & CHOCH
Market structural patterns , specifically the concepts of Change of Character (ChoCH) 🔄 and Break of Structure (BoS) 💥
Indicator
RSI
Breakout
XAUUSD
+5
Zones Supply Demand
📊Zones Supply & Demand: Identifies key price levels with high volume concentration, marking Supply/Demand Zones & Marke
Indicator
RSI
Breakout
Supertrend
All Support and Resistance Levels
"Identify key market zones and visualize support/resistance from multiple timeframes on a single chart.
Indicator
RSI
Breakout
XAUUSD
+6
Volume POC Heatmap
📊 Shows volume by price levels, highlights POC, and key zones. Identifies dynamic support/resistance and imbalances.
Indicator
RSI
Breakout
XAUUSD
+5
Supertrend
💹 Define a price channel 📈 and determine trend direction (bullish 🟢 or bearish 🔴).
Indicator
RSI
Breakout
XAUUSD
+6
Fair Value Gap Sessions
identify and highlight temporary market inefficiencies known as "fair value gaps" 🚨 within specific trading Sessions.
Indicator
RSI
Breakout
XAUUSD
+4
Dynamic Market Structure Analysis of Turning Points
Identify market structure effortlessly with swing highs, lows, CHoCH, and BOS levels for smart trading decisions! 📊🔍"
Indicator
Indices
RSI
XAUUSD
+7
RSI Divergence
Detects bullish and bearish divergences
Indicator
RSI
Breakout
Supertrend
Trend Heikin Multi MA
🚀 TrendHeikinMultiMA: Advanced trend detection using Heikin-Ashi smoothing & MAs! Eliminates noise, confirms real trend
Indicator
RSI
Breakout
XAUUSD
+4
Multi-Level Candle Bias Tracker
Price direction by calculating the probability of reaching new highs/lows. Shows levels & stats📈
Indicator
RSI
Breakout
Supertrend
Leverage Liquidation Map
📊 Liquidation Map: Potential areas where highly leveraged investors might face liquidations.
Indicator
RSI
Breakout
Supertrend
Market Trend OB
Price action to detect when the market changes trend (MSB) and defines, order blocks , ZigZag etc.📊
Advanced Market Structure Bos,Choch,SwinLevels, Order Blog
Advanced price action tool that combines multiple technical analysis concepts
Indicator
RSI
Breakout
Supertrend
+3
Fibonacci Linear Regression Multi-timeframe
Combining Fibonacci levels and regression to analyze multidimensional market trends across multiple timeframes¡
Indicator
RSI
Breakout
Supertrend
Zig-Zag Extremity Tracker
Dynamically adjusts regression channels based on ZigZag extremes, resetting when price breaks bands to track real trends
You may also like
Indicator
Stocks
Forex
MACD
+1
SmartBot-Volume MACD
a revolutionary indicator that integrates volume into MACD.
Indicator
NAS100
RSI
NZDUSD
+15
Inside Candle
Highlight market consolidation zones instantly with this Inside Candle indicator — precise, clean, and powerful.
Indicator
RSI
Breakout
XAUUSD
+13
Fear & Greed Index
Fear & Greed Index: 4 configurable components (momentum, volatility, strength, pattern) with 6 calculation methods each
Multi Volume Profile
Advanced customizable volume-profile indicator with buy/sell levels, delta analysis, multi-TF support and vivid gradient
Tape reader
TAPE READER :-)
Indicator
Indices
Forex
session indicator
📈 Trading Sessions Indicator — London, New York & Tokyo Visualize Key Market Sessions + High/Low Levels with Precision
Indicator
Indices
Commodities
Stocks
+2
MARainbow
MARainbow gives you the edge with four customizable moving averages—each color-coded for instant recognition.
ZigZag Price Liquidity Projection
📊 ZigZag Liquidity Projection: Predict bounces/breaks using pivots, ATR & volume.
Market Polarity Zones
implifies market analysis by automatically identifying bullish 🚀 or bearish 🐻 phases and marking key levels where ....
Indicator
NAS100
Indices
Breakout
+7
ORB Range with FVGs
This indicator plots the 15m opening range of the NY session with the first N FVGs presented on the chart after the open
Indicator
RSI
Forex
Signal
+1
RSI AUSAMA
Advanced RSI: Enhanced algorithm, signal line, smart colors, shaded zones, 4 MA types - Superior accuracy for pro tradin
Pivot Points Clasic,FIBO,etc
All-in-one Pivot Indicator: set Classic, Fibo, Woodie, Camarilla, Demark methods, style levels & labels your way ;)
HeatMap Candle
HeatMap Candle
Indicator
RSI
Breakout
XAUUSD
+9
Square Matrix Trading System
Square Matrix Trading System by LudwigICT – Institutional-Grade Trading Clarity in cTrader
Indicator
RSI
Breakout
Supertrend
Swing Levels
🔍 Automatically detect support and resistance levels based on "swings" or pivots
IR Ichimoku Macd
this indicaotr show distance between Tenkan to Kijun, Close to Kijun and Close to Tenkan 
Indicator
XAUUSD
Commodities
Forex
+10
Perfect Entry Price
Perfect Entry Price designed to help traders identify the most accurate and reliable price levels for market entries