
Description
🚀 10,000+ traders already use our TOP indicators🏆
Discover why professionals choose us – the most powerful tools on cTrader (indicators, algorithms, and cBots) are waiting for you.
👉 Get all our TOP systems here:
_______________________________________________
📌 Market Structure Indicators
· ✅ AdvancedMarket Structure: Bos, Choch, SwinLevels, Order Blocks, Market Structure& Liquidity Finder
· 🔄 Dynamic Market StructureAnalysis of Turning Points
· 🧱 Order Block
· ⚖️ Market Imbalance
· ⛓️ BOS & CHOCH
· 🧠 ICT Power of 3
_______________________________________________
🔚 Smart Exit Systems
_______________________________________________
📐 ZigZag Indicators
· 🔍 ZigZag Price LiquidityProjection
· ➖ ZigZag
_______________________________________________
🧱 Support & Resistance Indicators
· 🟩 SmartTrend Support &Resistance Lines
· 🧱 All Support and ResistanceLevels
_______________________________________________
📊 Trend & Channel Indicators
· 📊 Supertrend
_______________________________________________
💧 Volume & Liquidity Tools
_______________________________________________
⚡ Momentum & RSI Indicators
· 🔎 Multi-Level Candle Bias
Tracker
_______________________________________________
🔮 Prediction & Projection Tools
· 📐 Prediction Based on Linreg& ATR
· 📏 Fibonacci Linear RegressionMulti-timeframe
· 📈 Volume-Powered Market Flow Projector
______________________________________________________________________________________________
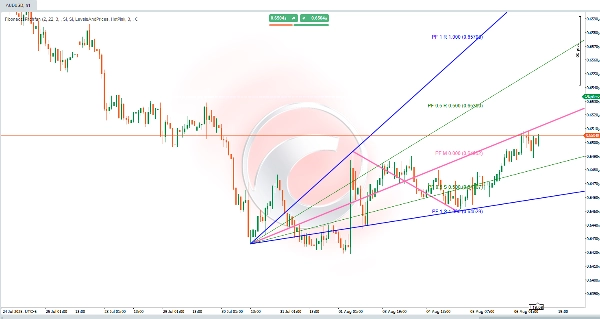
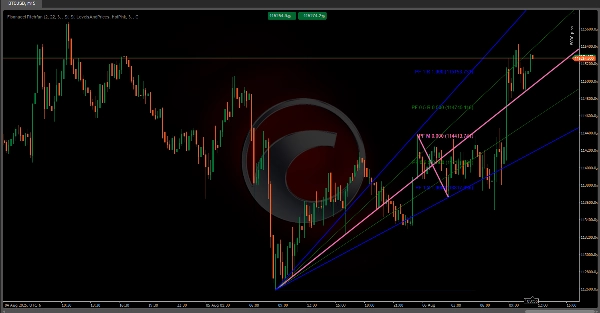
Fibonacci Pitchfan 📊✨
An advanced technical indicator that combines pivot detection, dynamic trendlines, and Fibonacci levels to create a visual tool helping traders identify trends, support/resistance zones, and potential reversal points. 🎯 Highly customizable, it adapts to different trading styles via configurable parameters. Below is a breakdown of its logic and calculations.
Core Components 🔧
The indicator relies on three key elements working together:
1. Pivot Detection 🔄
- Identifies key price reversal points (high/low pivots).
- Uses a user-defined bar range (pivot depth) to determine if a bar is a significant high/low vs. surrounding bars.
- Filters noise by requiring pivots to exceed an ATR-based deviation threshold, ensuring only relevant price swings are considered.
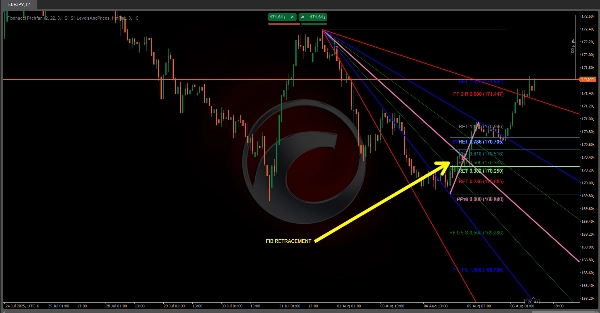
2. TrendFan & Fibonacci Levels 📐
- Projects a fan of dynamic trendlines from a historical pivot into the future, using predefined levels (e.g., 0.25, 0.5, 1.0) to mark potential support/resistance.
- Optional Fibonacci levels (horizontal lines) highlight retracement/extensions between key pivots.
Calculation Logic 🧮
1. Pivot Identification
- For each bar, the algorithm scans a symmetrical range of prior/following bars (based on pivot depth).
- A high pivot is confirmed if the bar’s high is the highest in the range; a low pivot if its low is the lowest.
- The deviation threshold (a % of ATR relative to price) filters out minor fluctuations, focusing on meaningful market moves.
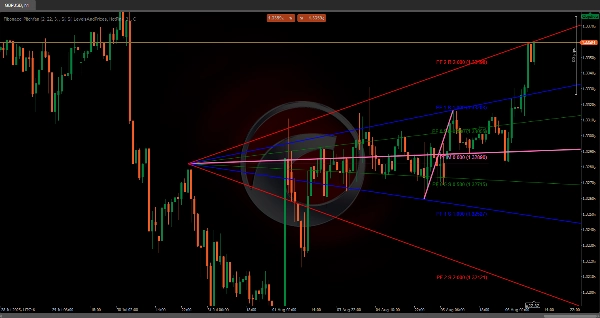
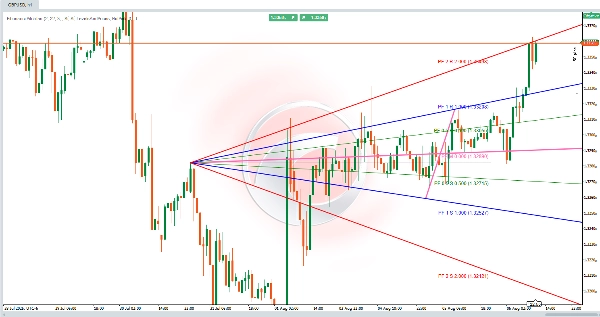
2. TrendFan Generation 🌪️
- A reference historical pivot (configurable) is paired with the latest pivot to form a baseline.
- A median line is drawn between them, and projected trendlines (at predefined levels) extend into the future, creating a "fan" of key price zones.
3. Fibonacci Projections 🔢
- Retracement levels (e.g., 0.236, 0.5, 0.618) mark potential pullback areas within the prior price move.
- Extension levels project price targets beyond the initial range, adjusted for trend direction.
- Levels can be inverted or extended based on user settings.
Customizable Settings ⚙️
- Deviation Threshold: Adjusts sensitivity to price moves (ATR-based).
- Pivot Depth: Defines the bar range for pivot detection (affects signal frequency).
- Historical Reference: Sets how far back the initial pivot is selected for the TrendFan.
- Visibility: Toggles TrendFan/Fibonacci display and selects specific levels to show.
Conclusion 🏆
The Fibonacci Pitchfan is a powerful all-in-one tool for traders seeking a clear, dynamic view of market structure. By merging pivots, trendlines, and Fibonacci levels, it provides actionable insights to anticipate price movements and make informed decisions. 🚀
Summary
It generates a "TrendFan" by projecting dynamic trendlines from a configurable historical pivot to the latest pivot, creating a fan of key price zones. Optional Fibonacci retracement and extension levels highlight potential pullback areas and price targets, which can be customized or inverted according to user preferences.
Key customizable settings include deviation threshold sensitivity, pivot depth (bar range for pivot detection), historical reference for the initial pivot selection, and visibility options for TrendFan and Fibonacci levels. This tool is suitable for traders seeking actionable insights to anticipate price movements and make informed decisions based on a comprehensive view of market dynamics.


