Brokers & props
For business
00
Days
:
00
Hours
:
00
Minutes
:
00
Seconds
Darvas Box
Indicator
174 downloads
Version 1.0, Mar 2025
Windows, Mac
Since 03/10/2024
Sales
2
Free installs
6120
"Darvas Box" uploaded image"Darvas Box" uploaded image"Darvas Box" uploaded image"Darvas Box" uploaded image"Darvas Box" uploaded image

Darvas Box Theory

The Darvas Box theory is a trading technique developed by Nicolas Darvas in the 1950s. It's a momentum-based trading strategy that uses price action to identify potential entry and exit points in the market.

How Darvas Box Works

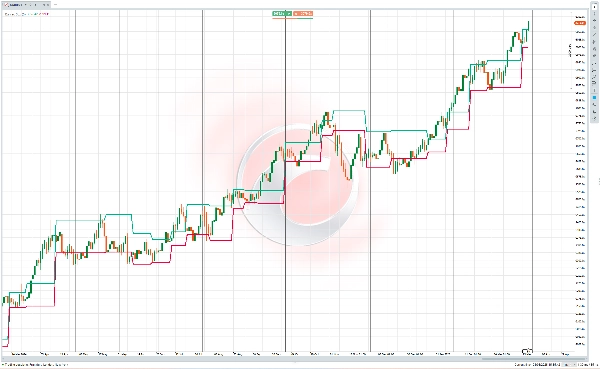
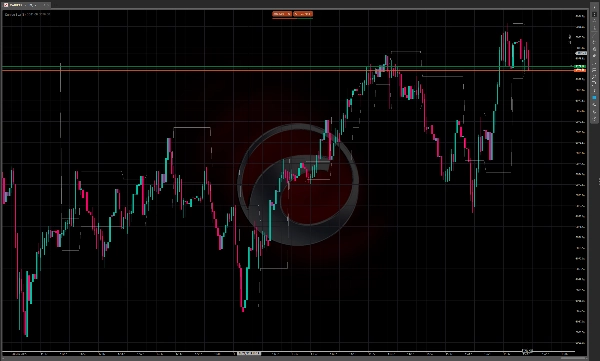
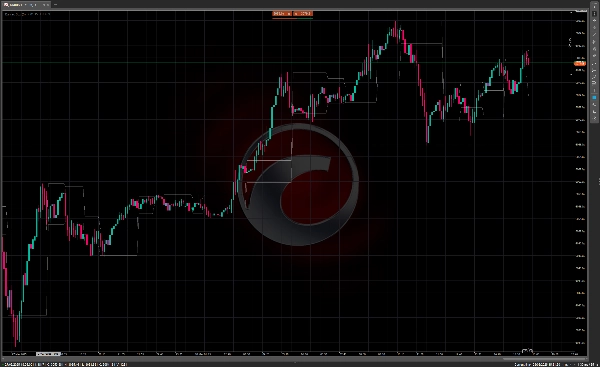
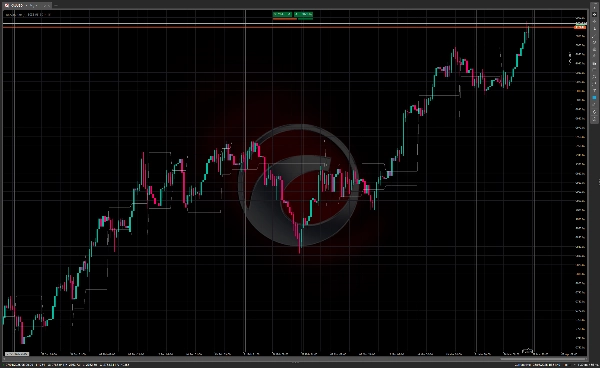
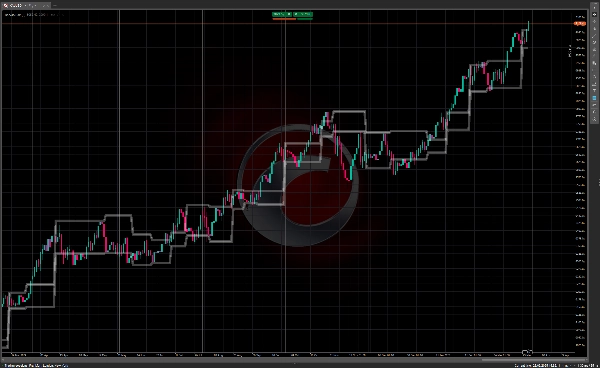
The Darvas Box method involves identifying "boxes" or trading ranges where a stock's price consolidates before breaking out. The key components include:

  1. Price forms a defined trading range (the "box") with clear upper and lower boundaries
  2. The upper boundary represents resistance, while the lower boundary acts as support
  3. A breakout above the box signals a potential buying opportunity
  4. A breakdown below the box can be used as a selling signal

Traders using this technique typically look for stocks showing increasing volume along with the price movement, as this suggests stronger momentum behind the breakout.

History of Darvas Box Theory

Nicolas Darvas (1920-1977) was a rather unusual figure in trading history. Born in Hungary, he was not a professional trader by training but rather a dancer who performed in a ballroom dance duo called "Darvas and Julia" with his half-sister.

While touring worldwide with his dance troupe in the 1950s, Darvas began experimenting with stock trading. His circumstances were unique—he often made investment decisions based only on stock tables in newspapers delivered to him in various cities during his tour.

Darvas developed his box theory through trial and error. Initially, he lost money in the markets but gradually refined his approach. Between 1956 and 1958, he reportedly turned an investment of $10,000 into over $2 million using his box method—an extraordinary feat that gained attention.

In 1960, Darvas published his methods in the book "How I Made $2,000,000 in the Stock Market," which became a classic in trading literature. The book detailed his journey and explained his box theory, bringing this approach to mainstream attention.

What made Darvas's method particularly notable was its simplicity and that it was developed by an outsider to the financial industry. He focused primarily on price action and volume rather than fundamental analysis, an approach that was somewhat novel at the time but has since influenced many technical trading systems.

The Darvas Box technique remains popular among technical traders today, particularly those who follow momentum-based strategies in trending markets.

0.0
Reviews: 0
Customer reviews
No reviews for this product yet. Already tried it? Be the first to tell others!
Breakout
Stocks
Signal

More from this author

Top-rated
Free
Indicator
ATR
Supertrend
PMAX
It's a combination of two trailing stop loss and the other one is well-known ATR-based SuperTrend.
cBot
Grid
RSI
XAUUSD
+18
Investion X V1.9 - Intelligent Filter-Based Trading System
Trading system combining martingale strategy with multi-layered technical analysis and comprehensive protection features
Indicator
RSI
Indices
StochasticRSI
Stochastic RSI (StochRSI) is a technical indicator used to measure the strength and weakness of the RSI.
Indicator
Indices
AI
Machine Learning Momentum Index
The Machine Learning Momentum Index (MLMI) represents the next step in oscillator trading.
Laguerre RSI
Laguerre RSI is based on John EHLERS' Laguerre Filter to avoid the noise of RSI.
KDJ
The KDJ oscillator display consists of 3 lines (K, D and J - hence the name of the display) and 2 levels.
Indicator
Breakout
Forex
On Balance Volume
On Balance Volume (OBV) measures buying and selling pressure as a cumulative indicator.
Quantitative Qualitative Estimation
The QQE (Quantitative Qualitative Estimation) Weighted Oscillator improves its original version by weighting the RSI.
Indicator
Indices
Breakout
Stocks
+3
Ichimoku Cloud Indicator
The Ichimoku Cloud is a comprehensive technical analysis system developed by Japanese journalist Goichi Hosoda
cBot
Grid
Martingale
Investion Basic
This is a basic martingale bot without an indicator. For long and short trading options at the same bot.
Chaikin Money Flow
Chaikin money flow's primary purpose is to distinguish between periods of accumulation and distribution of a security.

You may also like

Indicator
Signal
ORB_Dashboard
Trades Opening Range Breakouts Indicator with dynamic stops/targets adapting to market volatility.
Indicator
Breakout
Higher Timeframe Candlestick
Overlay a real-time higher-timeframe candle on your chart — color-coded bias without switching TFs.
VWAP Tokyo Open
VWAP Set to Tokyo Open
VegaXLR - Market Sessions Alerts
The cTrader Market Sessions Alerts Indicator marks global sessions, highlights key levels, and sends real-time alerts.
Indicator
NAS100
Breakout
XAUUSD
+10
AutoAVWAP
The best automatic anchored VWAP indicator every trader can get help from.
Indicator
Breakout
Scalping
KAMAKeltner
KAMA Keltner – Adaptive Volatility Channel for Precision Trading
Indicator
Indices
Stocks
Commodities
+2
SymbolTFOverlay
The SymbolTFOverlay display the current symbol and timeframe as a semi-transparent text overlay on the chart.
Indicator
NAS100
NZDUSD
Forex
+25
QX SmartStructure
SMC without the mess: Clean structure + auto-managing FVGs + MTF panel. Hard-right-edge, step size-based for any symbol.
Indicator
RSI
Breakout
XAUUSD
+6
Multi-Asset Performance Matrix
Visual tool tracking financial assets' % performance across timeframes, highlighting trends with color-coded insights.
Indicator
Grid
RSI
XAUUSD
+12
PFO Price Flow Oscillator
technical analysis tool designed to provide traders with a structured view of market momentum and volatility
Candelstick xxl
The indicator is designed to detect aggressive movements in the market and without volume for trend changes.
Indicator
Grid
NAS100
NZDUSD
+15
EMA UP&DOWN 2025
SectorIndex Dual Moving Average Indicator: Your Market Compass 🧭