Indicator
ATR
Supertrend
PMAX
"PMAX" logo
5.0
03/09/2025
1239
Desktop
Since 03/10/2024
Sales
1
Free installs
5219
"PMAX" uploaded image"PMAX" uploaded image"PMAX" uploaded image"PMAX" uploaded image

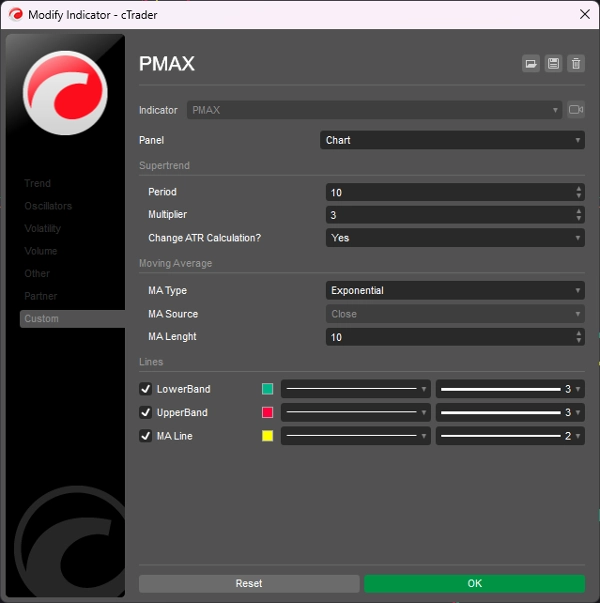
PMax (Profit Maximizer) is a brand new indicator developed by KivancOzbilgic in earlier 2020.

It's a combination of two trailing stop loss indicators;
One is Anıl Özekşi's MOST (Moving Stop Loss) Indicator and the other one is well known ATR based SuperTrend.

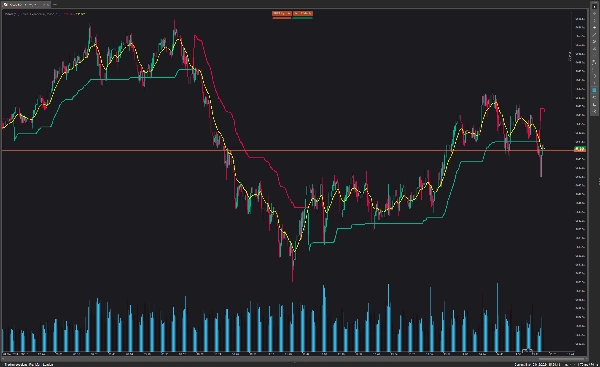
Both MOST and SuperTrend Indicators are very good at trend following systems but conversely their performance is not bright in sideways market conditions like most of the other indicators.

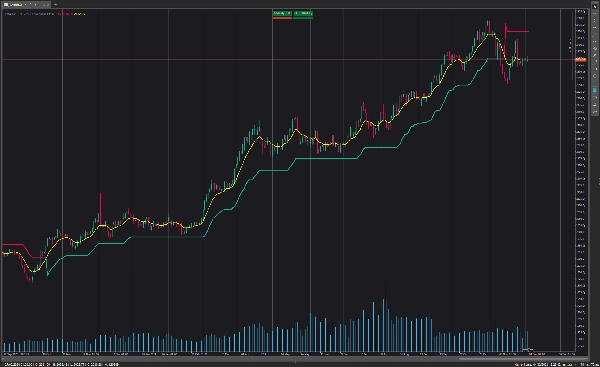
Profit Maximizer - PMax tries to solve this problem. PMax combines the powerful sides of MOST (Moving Average Trend Changer) and SuperTrend (ATR price detection) in one indicator.

Backtest and optimization results of PMax are far better when compared to its ancestors MOST and SuperTrend. It reduces the number of false signals in sideways and give more reliable trade signals.

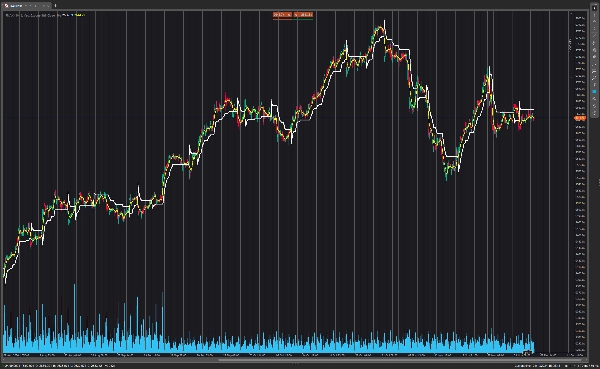
PMax is easy to determine the trend and can be used in any type of markets and instruments. It does not repaint.

5.0
Reviews: 4
5
100 %
4
0 %
3
0 %
2
0 %
1
0 %
Customer reviews
August 12, 2025
Fantastic Job at translating. Could you tell us how you did the ATR normalization in ctrader, I can't figure it out and I want to built an cbot with this opttion ty!
July 9, 2025
Pros: Combines Moving Average and ATR for dynamic trend detection. Provides clear buy/sell signals. Easy setup, stable performance. Cons: No alerts on signal change. No tooltips or saved templates. Requires additional confirmation for reliable entries.
June 16, 2025
April 25, 2025
please can I get the source code of this indicator
More from this author
MultiTimeFrame Moving Averages
3 moving averages with different periods and different time frames.
cBot
VWAP
RSI
Breakout
+5
Investion X V1.9 - Intelligent Filter-Based Trading System
Trading system combining martingale strategy with multi-layered technical analysis and comprehensive protection features
Indicator
Indices
AI
Machine Learning Momentum Index
The Machine Learning Momentum Index (MLMI) represents the next step in oscillator trading.
Indicator
RSI
Indices
StochasticRSI
Stochastic RSI (StochRSI) is a technical indicator used to measure the strength and weakness of the RSI.
Laguerre RSI
Laguerre RSI is based on John EHLERS' Laguerre Filter to avoid the noise of RSI.
Indicator
Breakout
Forex
On Balance Volume
On Balance Volume (OBV) measures buying and selling pressure as a cumulative indicator.
KDJ
The KDJ oscillator display consists of 3 lines (K, D and J - hence the name of the display) and 2 levels.
Quantitative Qualitative Estimation
The QQE (Quantitative Qualitative Estimation) Weighted Oscillator improves its original version by weighting the RSI.
Indicator
Breakout
Stocks
Signal
Darvas Box
The Darvas Box involves identifying "boxes" or trading ranges where a stock's price consolidates before breaking out.
Chaikin Money Flow
Chaikin money flow's primary purpose is to distinguish between periods of accumulation and distribution of a security.
Indicator
Indices
Breakout
Stocks
+3
Ichimoku Cloud Indicator
The Ichimoku Cloud is a comprehensive technical analysis system developed by Japanese journalist Goichi Hosoda
cBot
Grid
Martingale
Investion Basic
This is a basic martingale bot without an indicator. For long and short trading options at the same bot.
You may also like
IR Candle Open
IR Candle Open plots customizable opening price lines for daily, weekly, and monthly candles
VegaXLR - RSI and StochRSI Alerts
VegaXLR's cTrader StochRSI identifies overbought/oversold RSI levels for precise trade entries.
Indicator
RSI
Indices
Stocks
+3
FiboTrend-Pro V2
New version of one of my favorites includes Fibonacci and moving average convergence divergence lines
Indicator
VWAP
ZigZag
Weis & Wyckoff System v2.0
Open Trade PipsV1
This indicator tracks the unrealised amount of pips in your open positions.
Indicator
RSI
XAUUSD
Breakout
+5
Dynamic Range MomentumI
This histogram helps visualize the strength and direction of market movements, making it easier to spot potential trends
Indicator
Indices
XAUUSD
Prop
+8
FREE Squeeze Momentum from TradingView
Squeeze Momentum - Anticipate explosive market moves before they happen
Indicator
NAS100
NZDUSD
XAUUSD
+11
Market Info bY MohammadKHR
Daily High & Low with live Percentage change.
Indicator
Signal
Scalping
[Stellar Strategies] Linear Regression Candles 1.1
Approach to price analysis by visualizing candlestick data through the lens of linear regression slopes 📈📉
Indicator
NAS100
NZDUSD
XAUUSD
+13
MACD Histogram PRO
Enhance MACD Histogram! Visualize bull and bear price changes with vibrant colors for clearer, more insightful trading.
Indicator
VWAP
XAUUSD
Forex
+2
Dynamic Swing Anchored VWAP
Bollinger Bands Breakout Oscillator (+ Alerts)
BB Breakout Oscillator with alerts! Spot trend reversals using Bollinger Bands. Bullish/Bearish crossovers Alerts.
Indicator
NAS100
NZDUSD
XAUUSD
+10
MarketSession-MX
😎Read the description before purchasing💩
[Stellar Strategies] Market Session Ultimate
Ultimate Session Tool: Boxes, OR, KZs, PD Levels, Overlaps, Custom Lines & Names, Info Panel! Highly customizable 📉📈
Indicator
NAS100
NZDUSD
Martingale
+26
Info Dashboard_noSourceCode
Read the market with AI: live sentiment, news impact, equity, spread & neural net signals in one dashboard.
Market Sessions V2_NSC
Market Session V2: Full Control. colors, history, session/text toggles, font size. Elevate your strategy!
Indicator
XAUUSD
Forex
EURUSD
+2
ALMA Smoothed Gaussian Moving Average
ALMA Smoothed Gaussian Moving Average (ASGMA) – by LudwigICT
Indicator
NAS100
NZDUSD
Breakout
+16
Market Structure Pro
Auto-detect support and resistance & structure, highlight pullbacks/BOS retests, and filter with candle confirmation.