
Description
The Comprehensive Guide to Ichimoku Cloud Analysis
History and Background
The Ichimoku Kinko Hyo (or Ichimoku Cloud) was developed by Japanese journalist Goichi Hosoda in the late 1930s. After years of research and backtesting with a team of assistants, Hosoda released his findings in 1969. The name "Ichimoku Kinko Hyo" translates to "one-glance equilibrium chart," which reflects its intended purpose: to allow traders to quickly assess multiple aspects of market action in a single view.
Hosoda's innovation was remarkable as he created this complex system decades before computer analysis was available, performing all calculations by hand. What makes the Ichimoku system unique is its holistic approach, integrating multiple time frames and dimensions of market analysis into a unified framework.
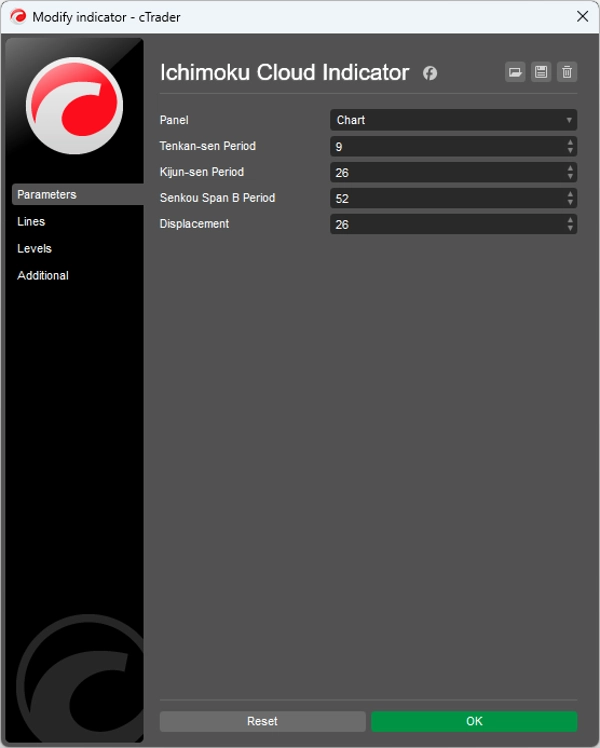
The Five Components of Ichimoku Cloud
The Ichimoku Cloud consists of five distinct lines, each providing specific insights:
1. Tenkan-sen (Conversion Line)
- Calculation: (Highest high + Lowest low) / 2 for the past 9 periods
- Function: Represents short-term market momentum
- Interpretation: Acts as a dynamic support/resistance level and trend indicator
2. Kijun-sen (Base Line)
- Calculation: (Highest high + Lowest low) / 2 for the past 26 periods
- Function: Represents medium-term market momentum
- Interpretation: Acts as a stronger support/resistance level and can serve as a trailing stop
3. Senkou Span A (Leading Span A)
- Calculation: (Tenkan-sen + Kijun-sen) / 2, plotted 26 periods ahead
- Function: Forms the leading edge of the cloud (Kumo)
- Interpretation: Projected support/resistance level
4. Senkou Span B (Leading Span B)
- Calculation: (Highest high + Lowest low) / 2 for the past 52 periods, plotted 26 periods ahead
- Function: Forms the trailing edge of the cloud (Kumo)
- Interpretation: Projected support/resistance level
5. Chikou Span (Lagging Span)
- Calculation: Current closing price, plotted 26 periods back
- Function: Confirms trends and identifies potential reversals
- Interpretation: When above price action, bullish; when below, bearish
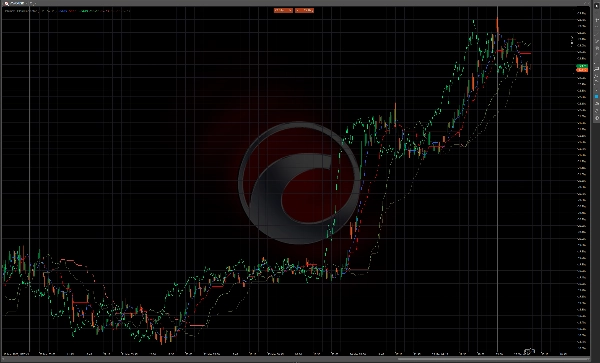
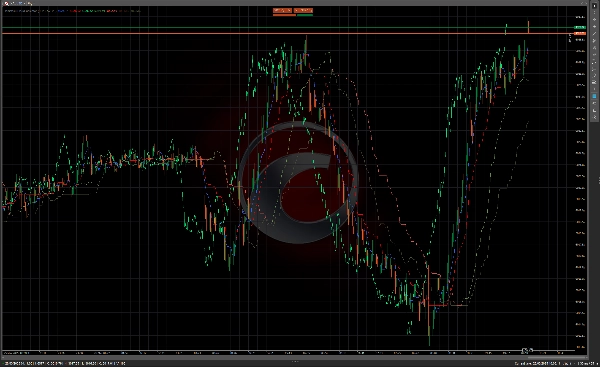
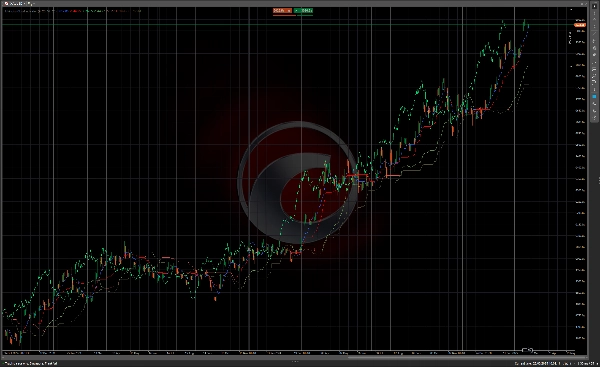
The Kumo (Cloud)
The area between Senkou Span A and Senkou Span B is called the "Kumo" or cloud. The cloud represents potential support and resistance zones and its thickness indicates market volatility and the strength of these zones.
- Thick Cloud: Strong support/resistance, higher volatility
- Thin Cloud: Weaker support/resistance, lower volatility
- Bullish Cloud: Senkou Span A above Senkou Span B (often colored green)
- Bearish Cloud: Senkou Span B above Senkou Span A (often colored red)
Trading Rules and Signals
Trend Determination
- Bullish Trend Criteria:
- Price is above the cloud
- Tenkan-sen is above Kijun-sen
- Chikou Span is above price from 26 periods ago
- Senkou Span A is rising and above Senkou Span B (bullish cloud)
- Bearish Trend Criteria:
- Price is below the cloud
- Tenkan-sen is below Kijun-sen
- Chikou Span is below price from 26 periods ago
- Senkou Span A is falling and below Senkou Span B (bearish cloud)
- Neutral/Range-bound Market:
- Price is within the cloud
- Tenkan-sen and Kijun-sen are flat or frequently crossing
Entry Signals
Bullish Entry Signals
- TK Cross (Tenkan/Kijun Cross):
- Tenkan-sen crosses above Kijun-sen
- Most effective when price is above the cloud
- Stronger signal when cloud is bullish
- Kumo Breakout:
- Price breaks above the cloud after being below or within it
- Stronger signal when cloud ahead is bullish (Senkou Span A > Senkou Span B)
- Chikou Span Confirmation:
- Chikou Span crosses above price from 26 periods ago
- No resistance ahead for Chikou Span
Bearish Entry Signals
- TK Cross (Bearish):
- Tenkan-sen crosses below Kijun-sen
- Most effective when price is below the cloud
- Stronger signal when cloud is bearish
- Kumo Breakout (Bearish):
- Price breaks below the cloud after being above or within it
- Stronger signal when cloud ahead is bearish (Senkou Span B > Senkou Span A)
- Chikou Span Confirmation (Bearish):
- Chikou Span crosses below price from 26 periods ago
- No support ahead for Chikou Span
Exit Signals
- Trend Reversal: When the criteria for the opposite trend start to appear
- TK Cross: When Tenkan-sen crosses Kijun-sen in the opposite direction
- Cloud Touch: When price touches the opposite side of the cloud
- Chikou Span Warning: When Chikou Span approaches historical price levels
Support and Resistance Levels
- Immediate Support/Resistance: Tenkan-sen and Kijun-sen
- Medium-term Support/Resistance: The cloud (stronger at flat sections)
- Kumo Twist: When Senkou Span A and B cross, creating potential reversal points
Advanced Ichimoku Techniques
1. Kumo Twist (Cloud Twist)
A Kumo Twist occurs when Senkou Span A and B cross, creating a potential reversal point 26 periods in the future. Traders often use this as an early warning signal for potential trend changes.
2. Time Frames Analysis
Many Ichimoku traders analyze multiple time frames:
- Higher time frame for overall trend direction
- Medium time frame for entry signals
- Lower time frame for precise entry timing
3. Senkou Span Widening/Narrowing
- Widening Cloud: Increasing market volatility, stronger trend
- Narrowing Cloud: Decreasing volatility, potential trend weakening
4. Flat Kumo (Flat Cloud)
When both Senkou Spans run parallel, it often indicates a strong trend with clear support/resistance levels.
Practical Applications
Ideal Market Conditions
Ichimoku Cloud works best in trending markets and across all time frames. It can be applied to:
- Forex
- Stocks
- Commodities
- Cryptocurrencies
- Indices
Risk Management
- Use the cloud as a dynamic stop-loss level
- Adjust position size based on cloud thickness (thicker cloud = higher volatility)
- Consider Kijun-sen as a trailing stop in strong trends
Timeframe Compatibility
The traditional settings (9, 26, 52) were based on the Japanese trading week (which had 6 days), so some traders adjust these settings:
- 10, 30, 60 for daily charts
- 20, 60, 120 for more conservative signals
- 7, 22, 44 for Western markets (5-day trading week)
Conclusion
The Ichimoku Cloud offers a comprehensive trading system that provides multiple layers of market information in a single view. What makes it powerful is not just individual signals but the confluence of multiple indicators working together. When all components align, the Ichimoku system can provide high-probability trading opportunities with clearly defined risk parameters.
While initially appearing complex, with practice, traders can indeed assess market conditions "at a glance" as Hosoda intended. The system's time-shifting components also provide a unique perspective on market dynamics, allowing traders to see potential future support and resistance levels before they become relevant.
Summary
1. Tenkan-sen (Conversion Line): short-term momentum indicator and dynamic support/resistance.
2. Kijun-sen (Base Line): medium-term momentum indicator and stronger support/resistance, also used as a trailing stop.
3. Senkou Span A (Leading Span A): forms the leading edge of the cloud (Kumo), projected 26 periods ahead.
4. Senkou Span B (Leading Span B): forms the trailing edge of the cloud, projected 26 periods ahead.
5. Chikou Span (Lagging Span): current closing price plotted 26 periods back, confirming trends and potential reversals.
The cloud (Kumo), formed between Senkou Span A and B, represents support and resistance zones, with thickness indicating volatility and strength. The indicator provides trend determination, entry and exit signals, and support/resistance levels. It is applicable across various markets including Forex, stocks, commodities, cryptocurrencies, and indices, and works best in trending markets and multiple time frames. Risk management features include dynamic stop-loss levels based on the cloud and position sizing adjustments according to cloud thickness. Traditional settings are (9, 26, 52) periods, with common adjustments for different trading weeks.


