
Descrizione
La ZLEMA (Zero Lag Exponential Moving Average) è una versione avanzata della Media Mobile Esponenziale (EMA) progettata per ridurre il ritardo comunemente associato alle EMA tradizionali. Utilizzando un metodo di calcolo specializzato, la ZLEMA reagisce più rapidamente ai cambiamenti di prezzo, rendendola particolarmente efficace nei mercati volatili.
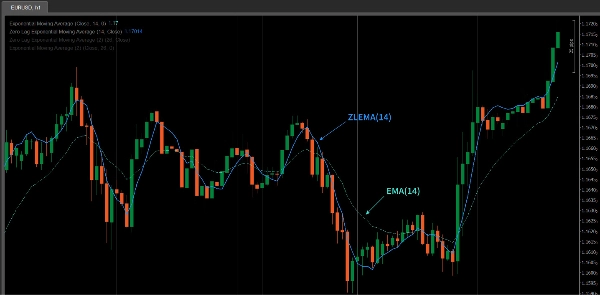
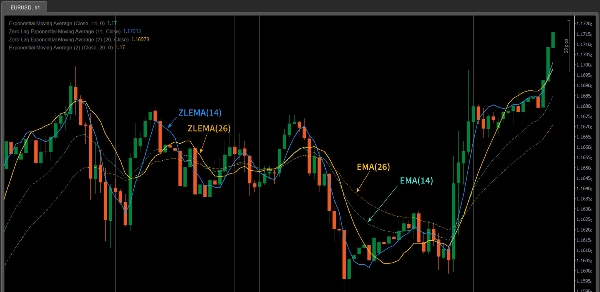
La caratteristica chiave della ZLEMA è la sua caratteristica di "zero lag", che le consente di seguire i movimenti dei prezzi più da vicino, soprattutto in condizioni di mercato in rapido movimento. Rispetto alla EMA tradizionale, la ZLEMA offre tempi di risposta più rapidi, rendendola più tempestiva nel catturare le tendenze di mercato.
ZLEMA vs EMA
- Velocità di Risposta: la ZLEMA reagisce più velocemente rispetto alla EMA tradizionale. Compensando il ritardo, segue i cambiamenti di prezzo più prontamente.
- Effetto di Smussamento: la ZLEMA mantiene un effetto di smussamento simile alla EMA, minimizzando il ritardo del prezzo, rendendola più adatta ai mercati in rapido movimento.
- Caso d'Uso: se stai facendo trading in un mercato altamente volatile (come il trading a breve termine o intraday), la ZLEMA può superare la EMA in termini di reattività.
Caratteristiche dell'Indicatore ZLEMA
- Risposta a Ritardo Zero: la ZLEMA riduce il ritardo, permettendole di rispondere rapidamente alle fluttuazioni dei prezzi di mercato, rendendola più precisa nel catturare cambiamenti rapidi del mercato.
- Fluidità: nonostante offra una reattività più veloce, la ZLEMA conserva l'effetto di smussamento della EMA, aiutando a evitare il rumore causato dalle fluttuazioni di prezzo.
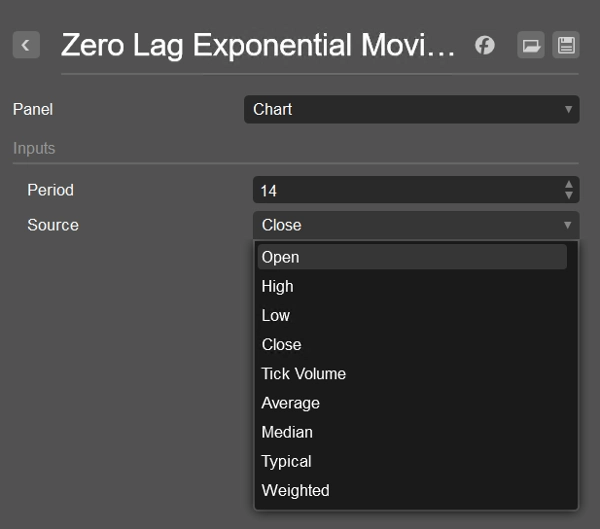
- Flessibilità: la ZLEMA può essere utilizzata con diverse fonti di dati di prezzo (come
Close,Open,High, ecc.), permettendo ai trader di adattarla in base alle esigenze della loro strategia. - Seguire la Tendenza e Conferma del Segnale di Inversione: la ZLEMA è ideale per identificare i cambiamenti di tendenza, specialmente nei mercati volatili, e per confermare i segnali di inversione del prezzo.
Come Usare l'Indicatore ZLEMA
- Trader a Breve Termine: la ZLEMA è perfetta per i trader a breve termine poiché può rispondere rapidamente alle fluttuazioni di prezzo. La sua reazione veloce la rende ideale per catturare inversioni di tendenza a breve termine o segnali di breakout.
- Seguire la Tendenza: la ZLEMA può anche essere utilizzata per tracciare tendenze a lungo termine ma offre maggiore sensibilità rispetto alla EMA. In una tendenza forte, la ZLEMA aiuta a identificare più rapidamente l'inizio o la fine delle tendenze, assistendo in aggiustamenti tempestivi della strategia.
- Combinazione con Altri Indicatori: la ZLEMA funziona bene se combinata con altri indicatori tecnici come RSI, MACD o l'analisi di pattern di prezzo per migliorare la precisione dei segnali. È particolarmente utile se combinata con indicatori di trend-following come le medie mobili per confermare breakout o inversioni di prezzo.
- Confermare Breakout e Inversioni: la ZLEMA può aiutare a confermare i breakout di prezzo da livelli chiave o segnali di inversione. Per esempio, quando il prezzo attraversa la linea ZLEMA, potrebbe indicare un cambiamento di tendenza, e viceversa.
- Riduzione del Rumore: grazie al suo ritardo ridotto, la ZLEMA è migliore nel filtrare il rumore che potrebbe essere presente nelle medie mobili tradizionali, rendendola uno strumento importante nel trading intraday o in mercati altamente volatili.
Consigli per l'Uso della ZLEMA
- Regola il Periodo: regola il periodo della ZLEMA in base al tuo stile di trading e alla volatilità del mercato. Per operazioni a breve termine, usa un periodo più breve (ad esempio, 10 o 14), mentre per il monitoraggio di tendenze a lungo termine, un periodo più lungo (ad esempio, 50 o 100) può essere più appropriato.
- Combina con Altri Strumenti: mentre la ZLEMA offre eccellenti capacità di seguire la tendenza, combinarla con altri indicatori come RSI per condizioni di ipercomprato/ipervenduto o MACD per la forza della tendenza può migliorare la precisione.
- Test e Ottimizzazione: le prestazioni della ZLEMA possono variare in diverse condizioni di mercato. Si consiglia di effettuare backtest e ottimizzazioni approfondite prima di utilizzarla nel trading live per garantire i migliori risultati nella tua strategia.
Riepilogo
Key features include:
- Zero lag response for timely reaction to price fluctuations.
- Smoothness that filters out noise without sacrificing responsiveness.
- Flexibility to use various price data inputs such as Close, Open, or High prices.
- Utility in trend following and confirming reversal signals.
ZLEMA is particularly useful for short-term traders seeking to capture rapid trend reversals or breakouts, as well as for longer-term trend tracking with enhanced sensitivity compared to EMA. It can be combined with other indicators like RSI or MACD to improve signal accuracy and confirm price breakouts or reversals.
Users can adjust the indicator’s period to match their trading style and market conditions, optimizing performance through backtesting. ZLEMA helps reduce noise and lag, making it a valuable tool for intraday and volatile market trading.


