
Beschreibung
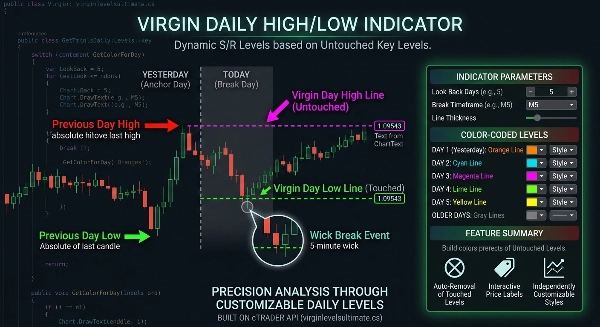
Vorheriges Tageshoch / Tief – Virgin Levels Ultimate
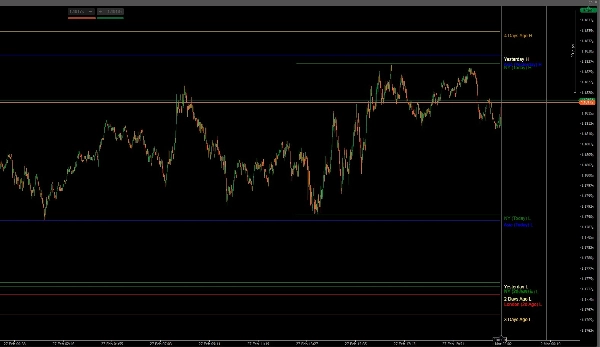
Virgin Levels Ultimate ist ein präziser Level-Tracking-Indikator, der automatisch unberührte Hochs und Tiefs der vorherigen Handelstage einzeichnet und diese in Ihrem Chart behält, bis der Preis sie durchbricht.
Entwickelt für Trader, die verstehen, dass unberührte Liquiditätsniveaus als Magneten für den Preis wirken, bietet dieses Tool Ihnen einen klaren, strukturierten Rahmen für Ausbruchs- und Umkehrstrategien.
Jetzt erweitert um Asia-, London- und New York-Session Hochs/Tiefs sowie vorherige wöchentliche und monatliche Levels, wodurch eine vollständige Multi-Timeframe-Liquiditätskarte entsteht.
Entwickelt für Forex, Indizes, Gold und Krypto – über alle Zeitrahmen hinweg.
Handeln Sie Schlüssel-Liquidität. Handeln Sie präzise.
⚙ Kern-Engine
- Automatische Erkennung der vorherigen täglichen Hochs und Tiefs
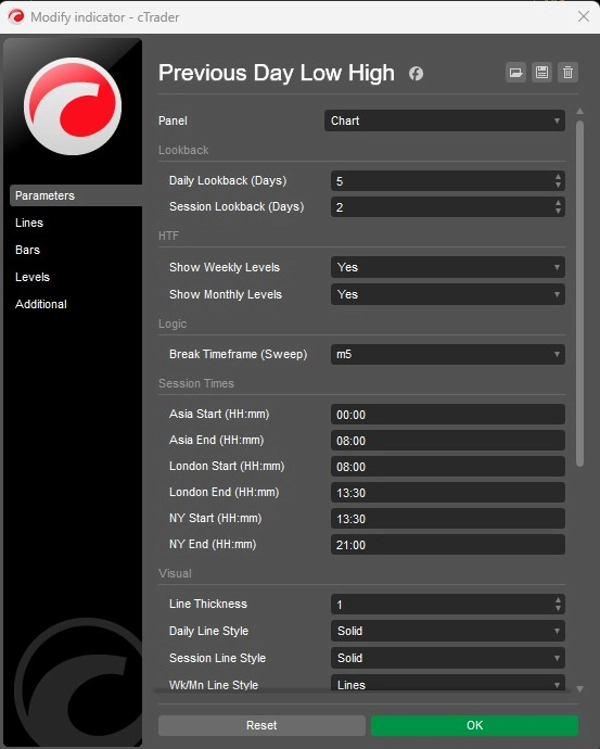
- Anpassbarer täglicher Rückblickzeitraum (Verfolgung mehrerer vergangener Tage)
- Erkennung von Hochs/Tiefs der Asia-, London- und New York-Session
- Kontrolle des Session-Rückblicks (Verfolgung mehrerer vorheriger Sessions)
- Vorheriges wöchentliches Hoch / Tief (optional)
- Vorheriges monatliches Hoch / Tief (optional)
- Levels werden erst ab der nächsten gültigen Handelsperiode aktiviert
- Automatische Entfernung, sobald das Level berührt wird (kein Durcheinander)
- Durchbruchserkennung basierend auf auswählbarem niedrigeren Zeitrahmen
- Echtzeit-Level-Validierung
📊 Virgin Level Logik
- Zeichnet nur unberührte (virgin) Hochs und Tiefs ein
- Tägliche, Session-, Wochen- und Monatslevels klar getrennt
- Mehrtägige Verfolgung (Tag 1 bis Tag 5+)
- Session-Verfolgung (Heute, Gestern, benutzerdefinierter Rückblick)
- Ältere Tage visuell unterschieden
- Dynamische Unterstützung- & Widerstandskartierung
- Liquiditätsbasierter Ausbruchsrahmen
- Multi-Timeframe-Konfluenzstruktur
🕒 Intelligente Break-Erkennung
- Auswählbarer Break-Zeitrahmen (z. B. M5, M15, etc.)
- Intraday-Präzision für Level-Invalidierung
- Hoch-/Tief-Scan ab gültiger Aktivierungszeit
- Funktioniert über tägliche, Session-, Wochen- und Monatslevels
- Stoppt das Zeichnen sofort nach bestätigtem Berühren
- Saubere Chart-Logik – kein historisches Überzeichnen
🎨 Volle Anpassung
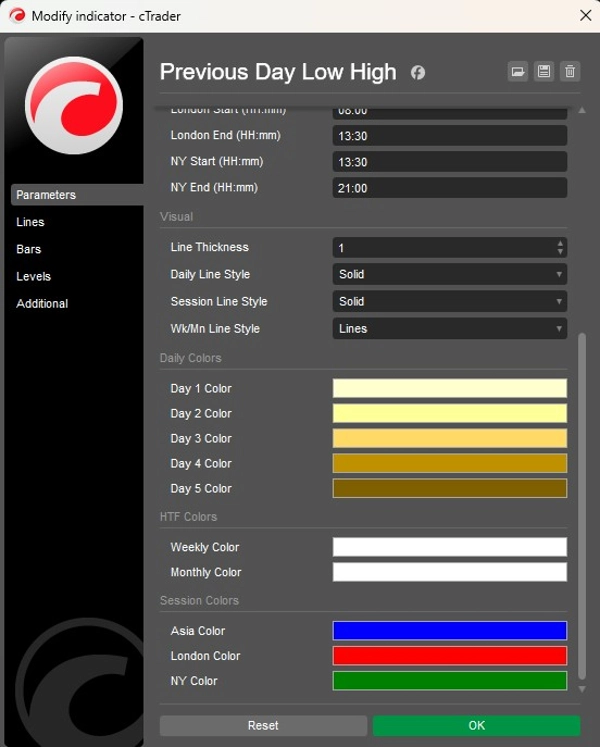
- Unabhängige Farbsteuerung für jeden täglichen Rückblick
- Dedizierte Farben für Asia-, London- und New York-Sessions
- Separate Farben für Wochen- und Monatslevels
- Anpassbare Linienarten (Täglich / Session / HTF)
- Einstellbare Linienstärken
- Automatische Preisschilder mit intelligenter Stapelung (kein Überlappen)
- Minimalistisches, professionelles Chart-Design
🎯 Ideal für
- Liquiditäts-Sweep-Trader
- Breakout- & Fakeout-Trader
- SMC / ICT-Stil Trader
- Session-basierte Trader (Asia, London, NY)
- Intraday- und Swing-Trader
- Prop-Firm-Regelbasierte Systeme
- Multi-Asset-Trader (Forex, Indizes, Metalle, Krypto)
Zusammenfassung
Key features include automatic detection and plotting of prior highs and lows, customizable lookback periods for days and sessions, real-time validation, and automatic removal of levels once touched to reduce chart clutter. It visually distinguishes older levels and separates daily, session, weekly, and monthly levels with independent color and style customization. The tool supports dynamic support and resistance mapping and provides a liquidity-based breakout framework suitable for Forex, indices, gold, cryptocurrencies, and other markets.
This indicator is suitable for liquidity sweep traders, breakout and fakeout strategies, smart money concept (SMC) and institutional trading (ICT) styles, session-based trading, intraday and swing trading, prop firm rule-based systems, and multi-asset trading. It offers a professional, minimal chart appearance with auto price labels and smart stacking.
Kundenbewertungen
5 | 100 % | |
4 | 0 % | |
3 | 0 % | |
2 | 0 % | |
1 | 0 % |


