

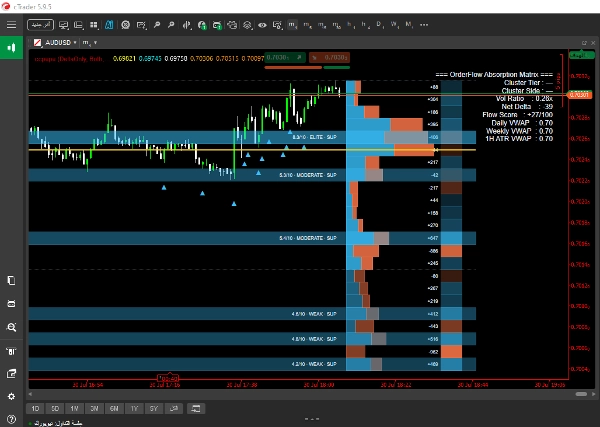
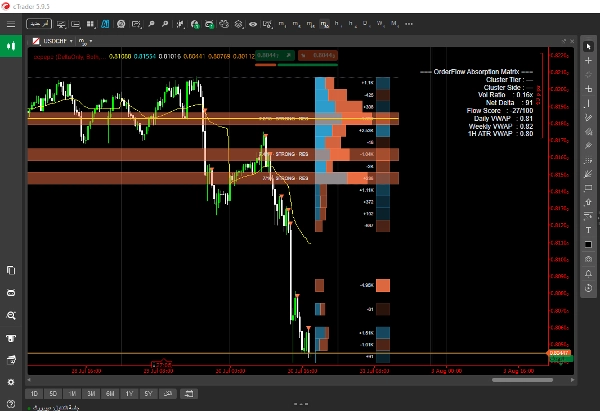
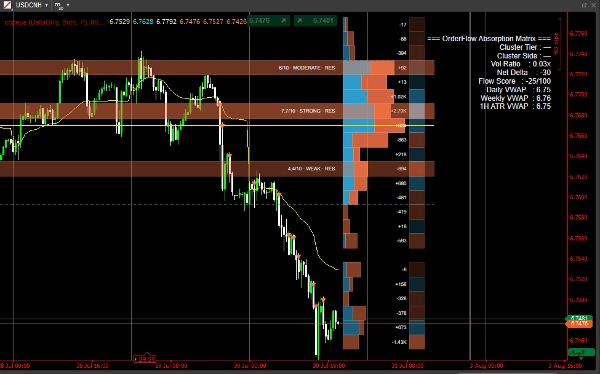
説明
1️⃣ オーダーフロー&デルタ検出
- 低時間足(LTF)ドリリング: インジケーターは各現在のバー内の低時間足のローソク足データ(例:1分足)を検査し、以下を計算します:
-
- ネットデルタ: 買いと売りの出来高の純差分。
- 吸収: バーの極端な価格帯で取引された大量の出来高が価格をさらに押し上げられず、市場流動性を吸収する大きな受動的リミット注文を示します。
- ホエールプリント検出: 3つの異なるルックバックウィンドウ(短期、中期、長期)で計算された動的な パーセンタイル とカスタマイズ可能な コンセンサスエンジン を組み合わせて、真の機関投資家の出来高スパイクを特定します。
2️⃣ 適応型ボリュームプロファイルエンジン
- ビン分割: 過去の価格範囲(ルックバックバー)を等しい垂直価格ビンに分割します。
- 出来高分布: 各ビンごとに買い出来高、売り出来高、デルタを分離し、チャートの右側に比例した水平プロファイルバーを描画します。
- 動的時間足処理: 固定秒数のティックに依存せず、インジケーターは実際のバーの期間(
GetCurrentBarSpan)を動的に評価します。これにより、非標準の時間足や市場セッションの休憩(株式市場の夜間ギャップなど)でのプロファイルの崩壊やラインの歪みを防ぎます。 - バリューエリア&POC計算:
-
- POC(ポイント・オブ・コントロール): 最も出来高の多い価格レベルを特定し、目立つアンカーラインで強調表示します。
- バリューエリア(VA): コア出来高割合(例:70%)を動的に特定し、バリューエリアハイ(VAH) と バリューエリアロー(VAL) を描画します。
3️⃣ 重み付けされたマルチファクターゾーンスコアリングシステム
各価格ビンは、1から10のスコアで評価される重み付けされたマルチファクターフォーミュラを使用して継続的に評価されます:
スコア=w1⋅出来高+w2⋅吸収+w3⋅タッチ+w4⋅拒否+w5⋅新しさ
- 自動ゾーンプロファイリング: 高スコアのレベル(エリート または ストロング)は、リアルタイムの数値強度バッジ付きで動的なサポート/レジスタンスゾーンとしてチャートに投影されます。
4️⃣ アンカードVWAPシグナル&実行トリガー
- 日、週、月の主要な時間的変化にアンカーされたVWAPベンチマークラインを計算します。
- アンカードVWAPに対する価格アクションを高出来高の クラスター・トリガー とともにクロス分析し、チャート上に精密なエントリー矢印をプロットします。
5️⃣ 画面上分析ダッシュボード
選択したチャートの任意のコーナーに配置されたクリーンなリアルタイムHUDが、市場状況の即時概要を提供します:
- クラスター階層: 現在のバーの分類(ホエール、ミディアム、スモール)。
- クラスターサイド&ネットデルタ: 方向性の流動性バイアスと正確なデルタ数値。
- 出来高比率: 移動平均に対する現在の出来高。
- フロースコア: −100から+100の範囲の正規化されたモメンタム/オーダーフロースコア。
- VWAPベンチマーク: アクティブなVWAPレベルのリアルタイム値。
概要
AIによる概要
OrderFlow Absorption Matrix is an advanced indicator for cTrader that provides detailed order flow and volume profiling to identify institutional trading activity. It analyzes lower timeframe candle data to calculate net delta (buy vs. sell volume) and absorption, highlighting heavy volume at bar extremes where price fails to move further, indicating large passive limit orders. The indicator detects significant volume spikes ("Whale Prints") using dynamic percentiles across multiple lookback windows combined with a consensus engine.
It features an adaptive volume profile engine that segments historical price ranges into equal bins, displaying buy volume, sell volume, and delta per bin with proportional horizontal bars. The profile dynamically adjusts for varying timeframes and market session breaks, calculating key levels such as Point of Control (highest volume price) and Value Area (core volume range).
A weighted multi-factor scoring system continuously evaluates price bins based on volume, absorption, touches, rejections, and recency, projecting high-scoring zones as dynamic support/resistance levels with numeric strength indicators. Anchored VWAP lines are calculated for key time anchors (day, week, month) and combined with volume cluster triggers to plot precise entry signals.
An on-screen analytics dashboard provides real-time summaries including cluster tier classification, directional delta, volume ratios, momentum scores, and VWAP benchmarks, aiding in market condition assessment and trade decision-making.
It features an adaptive volume profile engine that segments historical price ranges into equal bins, displaying buy volume, sell volume, and delta per bin with proportional horizontal bars. The profile dynamically adjusts for varying timeframes and market session breaks, calculating key levels such as Point of Control (highest volume price) and Value Area (core volume range).
A weighted multi-factor scoring system continuously evaluates price bins based on volume, absorption, touches, rejections, and recency, projecting high-scoring zones as dynamic support/resistance levels with numeric strength indicators. Anchored VWAP lines are calculated for key time anchors (day, week, month) and combined with volume cluster triggers to plot precise entry signals.
An on-screen analytics dashboard provides real-time summaries including cluster tier classification, directional delta, volume ratios, momentum scores, and VWAP benchmarks, aiding in market condition assessment and trade decision-making.
インジケーターのプロフィール
インジケーターのカテゴリー
統計
出力の種類
フィルター
データ要件
ティックデータ
サポート対象のシグナル
ラインブレイク
ラインタッチ
反転
ダイバージェンス
ディスカッション
カスタマーレビュー
0.0
レビュー: 0
カスタマーレビュー
この商品にはまだレビューがありません。お使いになったことがある方は、ぜひレビューをお願いします。
よくあるご質問
Bollinger Bands
Key Levels
Volume
Supply & Demand
VWAP
Support & Resistance
cTrader Storeで入手可能な取引ボット、インジケーター、プラグインなどの商品は、第三者の開発者が提供するものであり、情報と技術の取得のみを目的としてご利用いただけます。cTrader Storeはブローカーではなく、投資助言や個人的な推奨を行うことも、将来のパフォーマンスを保証することもありません。
この作成者の他の商品

![「Smart Money Concepts (SMC) [Iridio Capital]」ロゴ](https://cdn.ctrader.com/image/webp/b4b5414d-a5ca-44b7-a947-e28eca44a218_61548)



![「Wyckoff Toolkit [Iridio Capital]」ロゴ](https://cdn.ctrader.com/image/webp/5318c788-91ef-4297-bca6-4ce73b1516a8_61556)












価格
登録日 23/06/2025
1
販売