
Market Structure Pro
Indicator
3 purchases
Version 1.2, Jan 2026
Windows, Mac
4.3
Reviews: 3
Description
Market Structure Pro – Trendlines, Zones & Smart Entries
Market Structure Pro is a complete price-action toolkit that automatically maps the market’s swing structure, key support/resistance, true trendlines, and HH/LL zones—then optionally highlights high-probability pullback entries with built-in confirmation logic.
Instead of drawing everything by hand, the indicator continuously scans your chart in the background and keeps your structure, zones and signals up to date in real time.
What this indicator does
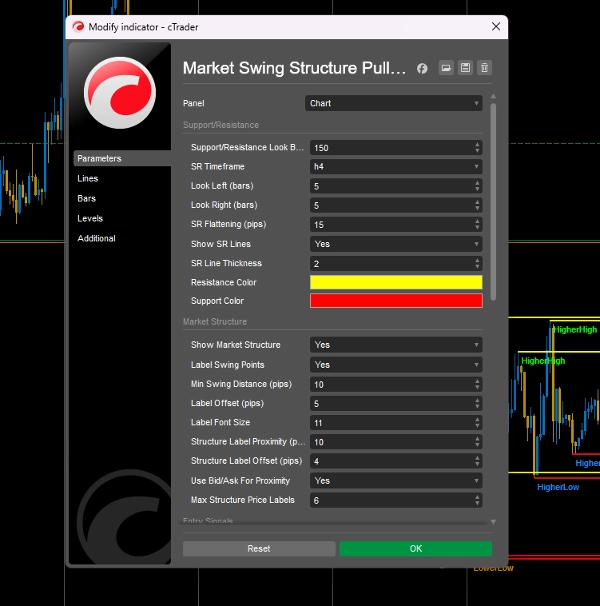
- Auto Support & Resistance
- Detects swing highs/lows over a configurable look-back range.
- Flattens nearby levels into cleaner zones using a pip tolerance.
- Draws interactive SR lines on any selected timeframe (e.g. 4H SR on M15 entries).
- Fully customizable thickness and colors for support and resistance.
- True Outer Trendlines
- Builds ascending/descending support and resistance trendlines from validated swing points.
- Controls to limit how many trendlines per direction are shown and to extend them into the future.
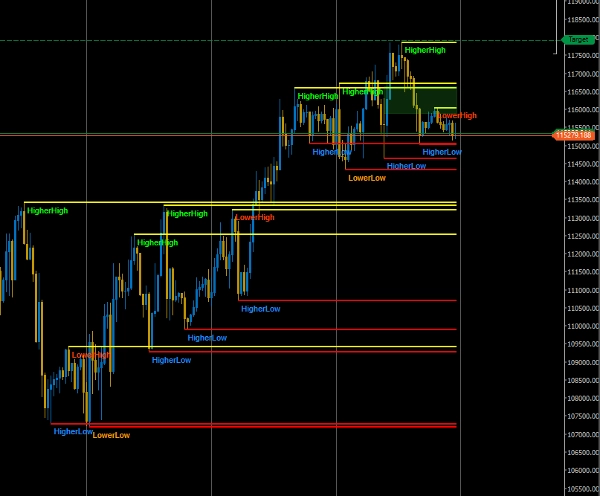
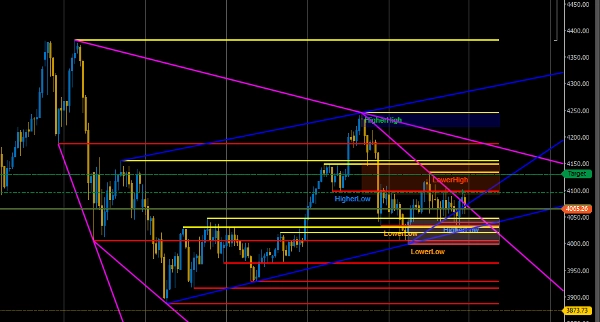
- Market Structure Mapping (HH, HL, LH, LL)
- Labels Higher High, Higher Low, Lower High, Lower Low swings directly on the chart.
- Adjustable minimum swing distance (pips) to remove market noise.
- Limits the number of active labels so your chart stays clean.
- Live text showing “Current Trend” (Uptrend / Downtrend / Sideways, with reversal notes).
- Built-in “Next Structure Prediction” message to give directional context.
- HH/LL Source-Candle Zones
- Auto-draws zones from the last Higher High and Lower Low source candles.
- Three zone modes:
- Full Candle (high ↔ low)
- Body Only (open/close range)
- Wick Only (upper wick for HH, lower wick for LL)
- Zone padding (pips), opacity, color for long/short zones, and choice to extend zones to the current bar.
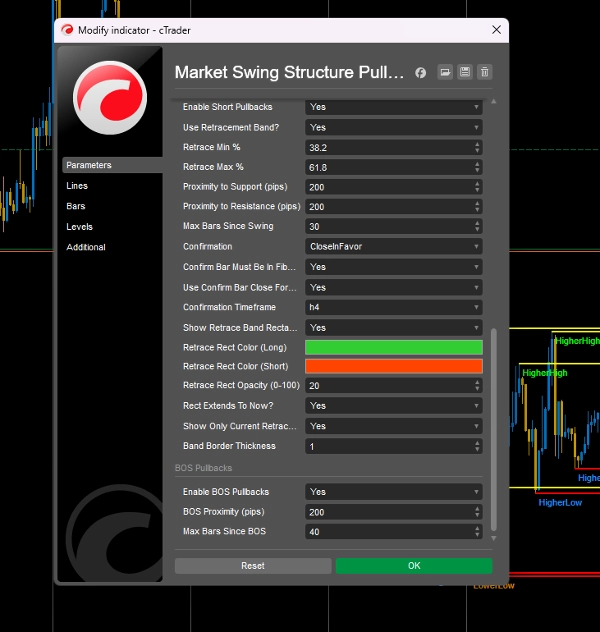
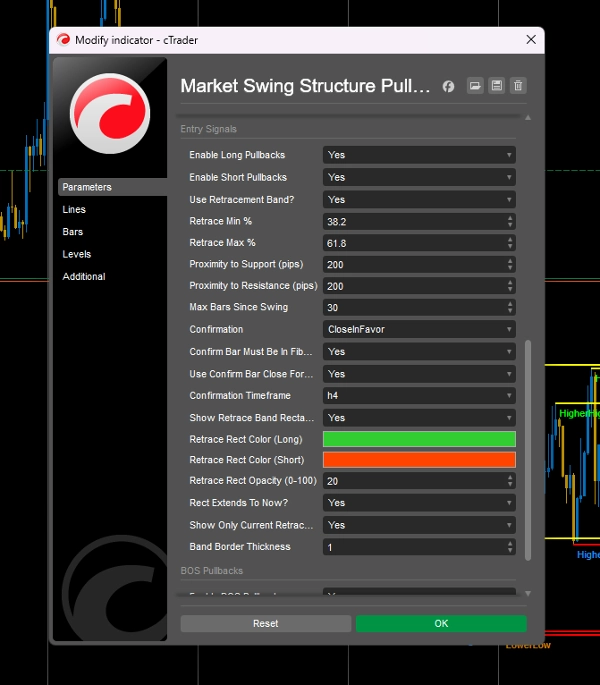
- Smart Entry Signals (optional)
- Master toggle to turn all entry signals on/off.
- Swing pullback entries:
- Uses the latest impulse leg (HH–HL or LH–LL).
- Builds a Fibonacci-style retracement band (e.g. 38.2–61.8%) for buys/sells.
- Checks proximity to swing points and SR levels.
- Limits how many bars after the swing a signal is still valid.
- Break-of-Structure (BOS) pullbacks:
- Detects BOS through key LH/HL breaks.
- Looks for retests of the BOS level and nearby SR.
- Uses separate proximity and “bars since BOS” filters.
- Confirmation Engine
- Multiple confirmation modes for entries:
- Close in favor only
- Engulfing candle only
- Close + Engulfing
- None (raw signals)
- Optional requirement that the confirmation candle must also be inside the retrace band.
- Separate confirmation timeframe (e.g. confirm on H4 while trading M15).
- You can choose to use the confirmation bar close as the actual signal price/time.
- Visual & Performance Controls
- Adjustable label offsets, font size, and max structure labels.
- Rectangle opacity, border thickness, and “extend to now” behavior for retrace bands and zones.
- Timer-based updates to keep calculations efficient even on lower timeframes.
Ideal for
- Price-action traders who rely on market structure (HH/HL/LH/LL).
- Swing and intraday traders who want higher-timeframe SR and trendlines visible on their entry chart.
- Traders looking for rule-based pullback entries around key structure, zones and BOS levels with clear confirmations.
How to use
- Choose your SR timeframe (e.g. H4) and look-back range.
- Enable Trendlines and adjust whether you want them extended and filtered for weekend gaps.
- Turn on Market Structure and labels to see HH/HL/LH/LL and live trend/prediction.
- Enable Zones and pick your preferred range mode (Full, Body, or Wick-only).
- If you want signals, enable Entry Signals, set your retrace band (e.g. 38.2–61.8%), proximities and confirmation behavior.
You still control your risk management and execution – Market Structure Pro gives you a structured, visual framework so you can focus on decision-making, not drawing.
Summary
AI summary
Market Structure Pro is a price-action indicator designed to automate the identification and visualization of key market elements for traders. It automatically detects swing highs and lows to map support and resistance zones, consolidating nearby levels into cleaner zones with customizable appearance. The indicator draws validated ascending and descending trendlines and labels market structure swings as Higher Highs, Higher Lows, Lower Highs, and Lower Lows, providing live trend status and next structure predictions.
It features auto-drawn zones based on the last Higher High and Lower Low source candles, with options for full candle, body only, or wick-only ranges. Smart entry signals include swing pullback entries using Fibonacci-style retracement bands and break-of-structure (BOS) pullbacks, both filtered by proximity and time since the swing or BOS event. A confirmation engine supports multiple modes such as close-in-favor, engulfing candles, or combined confirmations, with configurable confirmation timeframes and signal price options.
Visual and performance controls allow adjustment of label offsets, font sizes, opacity, and update frequency to maintain chart clarity and efficiency. Market Structure Pro supports various markets including Forex, indices, commodities, stocks, and cryptocurrencies, and is suitable for price-action, swing, and intraday traders seeking structured, rule-based analysis and entry signals without manual drawing.
Indicator profile
Customer reviews
4.3
Reviews: 3
5 | 33 % | |
4 | 67 % | |
3 | 0 % | |
2 | 0 % | |
1 | 0 % |
Customer reviews
October 23, 2025
ngl, this one makes sense if you are not trying to yolo every signal. Keeping it on demo first and see how it behaves when liquidity moves gets messy.
October 20, 2025
tested like a normal trader would, small size first. The idea is fine, but No need to scale it before seeing how it handles bad days.
October 10, 2025
I liked it more as a extra filter for smart money style analysis than as something to follow blindly. Structure is easier to map, and the final decision still feels like it belongs to the trader.
Discussion
FAQ
BTCUSD
Forex
Signal
Breakout
Indices
EURUSD
Commodities
GBPUSD
NZDUSD
Fibonacci
Prop
Scalping
Supertrend
SMC
Crypto
Stocks
XAUUSD
NAS100
USDJPY
Products available through cTrader Store, including trading bots, indicators and plugins, are provided by third-party developers and made available for informational and technical access purposes only. cTrader Store is not a broker and does not provide investment advice, personal recommendations or any guarantee of future performance.


!["Wyckoff Toolkit [Iridio Capital]" logo](https://cdn.ctrader.com/image/webp/8acfe6a1-6a8e-4578-9367-9df3af2b1801_27763)


Price
Since 31/10/2024
56
Sales
1.74K
Free installs