
Description
One indicator. Full trend context. Complete control.
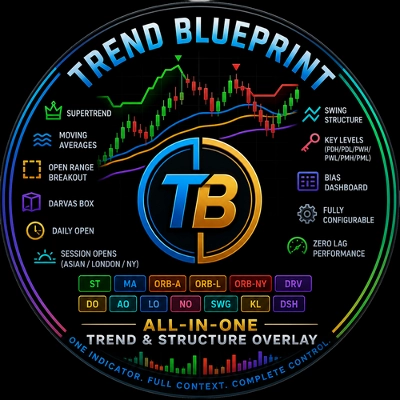
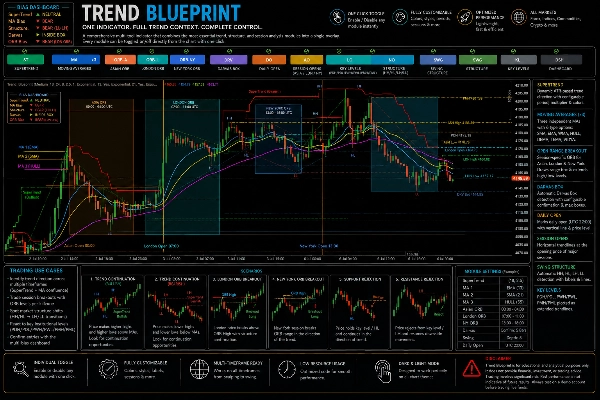
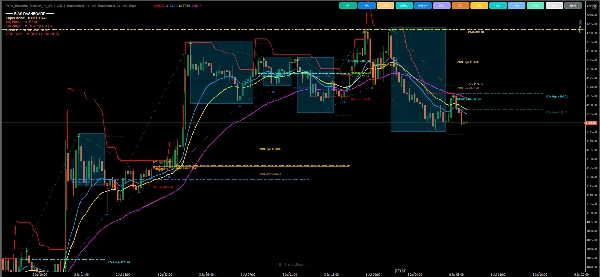
A comprehensive multi-tool indicator that combines the most essential trend, structure, and session analysis modules into a single overlay. Every module can be toggled on/off directly from the chart with one click.
MODULES INCLUDED:
SuperTrend
Dynamic ATR-based trend direction with configurable period, multiplier, and colored lines (bullish/bearish).
Multi Moving Averages (x3)
Three independent MAs, each with its own type selector: SMA, EMA, WMA, Hull, DEMA, TEMA, VIDYA. Mix and match freely.
Open Range Breakout (ORB)
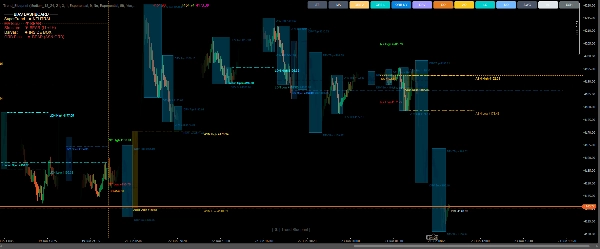
Session-specific ORB for Asian, London, and New York sessions. Draws the opening range box and extends high/low lines through the session. Fully configurable start/end times and duration.
Darvas Box
Classic Darvas Box pattern detection with automatic box drawing. Configurable confirmation period and max boxes displayed.
Daily Open
Marks the daily open (UTC 22:00) with a vertical line and horizontal price level extending forward.
Session Opens (Asian / London / NY)
Horizontal trendlines at the opening price of each major session. Configurable open times for any market.
Swing Structure
Automatic HH, HL, LH, LL detection and labeling with connecting lines. Color-coded for instant trend recognition.
Key Levels
Previous Day High/Low(PDH/PDL), Previous Week High/Low (PWH/PWL), and Previous Month High/Low (PMH/PML) drawn as extended trendlines with labels.
Bias Dashboard
Live on-chart panel showing current bias for Super Trend, Moving Averages, Swing Structure, Darvas Box status (breakout/inside/breakdown), and ORB position — all at a glance.
USE CASES:
• Identify trend direction across multiple timeframes ( Super Trend + MA confluence) • Trade session breakouts with ORB levels per killzone • Spot market structure shifts (HH/HL → LH/LL transitions) • React to key institutional levels (PDH/PDL/PWH/PWL/PMH/PML) • Confirm entries with the multi-bias dashboard
IDEAL FOR:
Scalpers, day traders, swing traders, and prop firm traders who want a clean, modular chart without loading 10 separate indicators.
Key Features
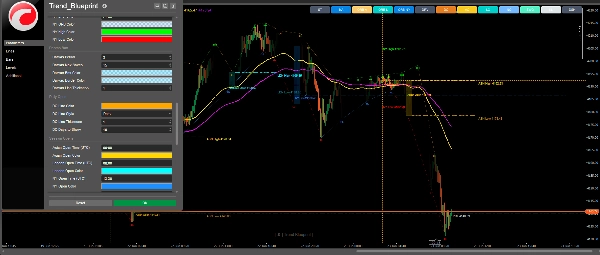
✔ Individual On-Chart Toggle Buttons
✔ Full Color Customization
✔ Adjustable Session Times (UTC)
✔ Multi-Monitor Scaling Support
✔ Optimized Performance & Low Resource Usage
✔ Dark & Light Theme Compatible
Disclaimer
Trend Blueprint is provided for educational and analytical purposes only. It does not provide financial, investment, or trading advice. All signals, levels, and market analysis generated by this indicator are informational and should not be considered buy or sell recommendations.
Trading financial markets involves significant risk, and past performance does not guarantee future results. Users are solely responsible for their trading decisions, risk management, and any profits or losses incurred through the use of this product. Always test on a demo account before trading live funds.
Summary
- SuperTrend: ATR-based dynamic trend direction with configurable parameters and color-coded bullish/bearish lines.
- Multi Moving Averages: Three independent moving averages with selectable types such as SMA, EMA, WMA, Hull, DEMA, TEMA, and VIDYA.
- Open Range Breakout (ORB): Session-specific breakout boxes for Asian, London, and New York sessions with adjustable times and durations.
- Darvas Box: Automatic detection and drawing of Darvas Box patterns with configurable settings.
- Daily Open and Session Opens: Markers for daily and major session opening prices with adjustable times.
- Swing Structure: Automatic detection and labeling of higher highs, higher lows, lower highs, and lower lows with color-coded trend lines.
- Key Levels: Extended trendlines for previous day, week, and month highs and lows.
- Bias Dashboard: On-chart panel summarizing current bias from multiple modules including SuperTrend, MAs, swing structure, Darvas Box status, and ORB position.
The indicator supports full color customization, adjustable session times (UTC), multi-monitor scaling, and is compatible with dark and light chart themes. It is designed for scalpers, day traders, swing traders, and prop firm traders seeking an all-in-one modular tool for trend and structure analysis.

















!["Wyckoff Toolkit [Iridio Capital]" logo](https://cdn.ctrader.com/image/webp/5318c788-91ef-4297-bca6-4ce73b1516a8_61556)








