
Description
🔥 Killzone Session With VWAP – Precision Meets Price Action 🔥
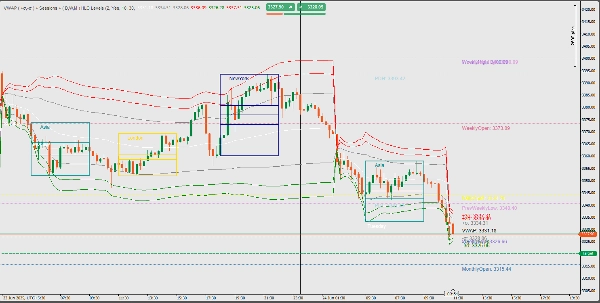
Killzone Sessions + VWAP is an all-in-one context indicator for manual traders who plan their day around session timing, VWAP mean-reversion, and key structural levels.
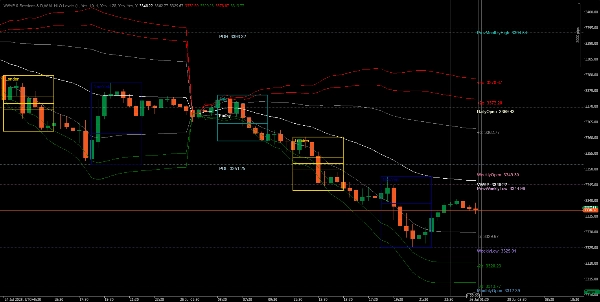
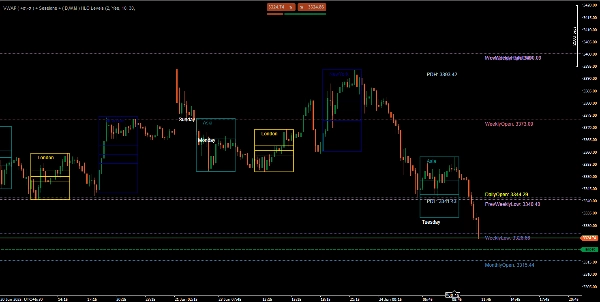
Session Killzones
- Draws Asia, London, and New York session boxes with automatic Fibonacci retracement lines (38.2 / 50 / 61.8) inside each completed range.
- Fully configurable time windows (UTC), colors, and independent transparency for each session.
- Adjustable session history so you can review recent days without cluttering the chart.
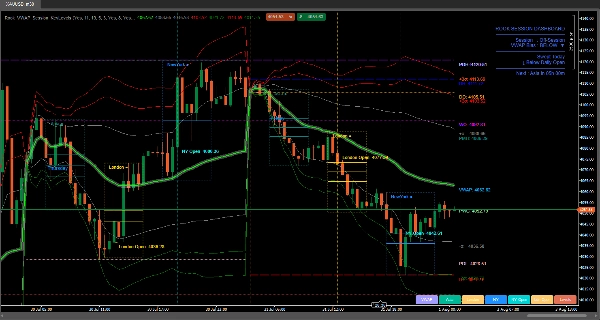
Anchored VWAP
- Session-anchored VWAP with 1σ, 2σ, and 3σ deviation bands.
- Configurable anchor/reset time, deviation multiplier, and band colors.
- Live labels showing current VWAP and band values.
Session Open Markers
- London Open and New York Open lines, each with adjustable time, color, and forward extension.
Key Levels
- Daily, weekly, and monthly high/low/open, plus previous day/week/month high/low/close.
- Individually toggleable visibility and color per level.
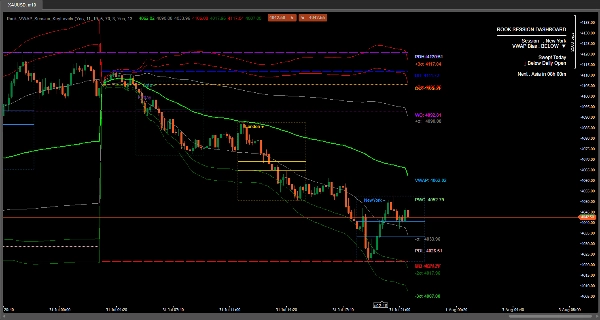
Live Dashboard
- On-chart panel showing active session, VWAP bias, swept key levels, and time to the next session.
This is a visual/analytical overlay only — it does not generate trade signals, alerts, or automated entries. It's built for traders who want faster, clearer situational awareness (session timing, mean-reversion context, and prior structure) on any symbol or timeframe.
Session, VWAP, Killzone, Key Levels, London Open, New York Open, Overlay, Intraday, Swing Trading, Forex, Indices
- Institutional FVG Zones MTF with Confluence
- All-in-One Session Levels Suite
- MARKET_STRUCTURE BOS_CHoCH
- Multi_TF Candlestick Chart Overlay
- ICT Killzones & Macros
- ICT_SMC_ToolKit
- VWAP_MTF
- Traders Dynamic Index (TDI)
- Market_Session_Forex
Unlock institutional-level insights with our Killzone Session With VWAP indicator for cTrader.
This advanced tool blends session-based strategy with volume-weighted pricing for maximum market clarity.
Disclaimer: Trading involves risk, and past results do not guarantee future performance. Use proper risk management, follow stop-loss levels, and trade responsibly. I am not liable for any financial losses from using these algorithms. use these indicators for your confluence and reduce burden your charting markup time
Summary
Customer reviews
5 | 50 % | |
4 | 50 % | |
3 | 0 % | |
2 | 0 % | |
1 | 0 % |


