
Market_Session_Forex
Indicator
4 purchases
Version 1.0, Jul 2025
Windows, Mac
4.5
Reviews: 2
Description
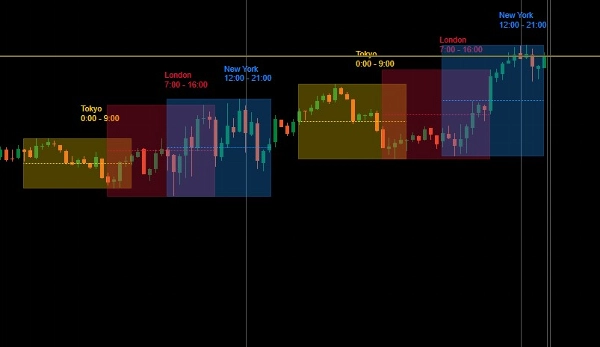
The Forex market operates 24 hours a day through overlapping global trading sessions. Each session reflects the activity of major financial centers and is characterized by varying levels of liquidity, volatility, and trading volume.
📊 The chart displays three primary sessions in coordinated time blocks:
🟡 Tokyo Session (Asian Session)
🔴 London Session (European Session)
🔵 New York Session (U.S. Session)
🧩 Overlap Periods:
- London–New York Overlap
Most active period of the trading day with peak volume and major price movements.
My Other Products
- Institutional FVG Zones MTF with Confluence
- All-in-One Session Levels Suite
- MARKET_STRUCTURE BOS_CHoCH
- Multi_TF Candlestick Chart Overlay
- ICT Killzones & Macros
- ICT_SMC_ToolKit
- VWAP_MTF
- Traders Dynamic Index (TDI)
- Market_Session_Forex
Summary
AI summary
Market_Session_Forex is an indicator designed for forex trading that visually delineates the three primary global trading sessions on a chart: the Tokyo (Asian) session, the London (European) session, and the New York (U.S.) session. Each session is displayed in coordinated time blocks, highlighting periods of varying liquidity, volatility, and trading volume. The indicator also marks the London–New York overlap, recognized as the most active trading period with peak volume and significant price movements. This tool aids traders in identifying key market activity windows aligned with major financial centers, facilitating more informed trading decisions based on session timing.
Indicator profile
Customer reviews
4.5
Reviews: 2
5 | 50 % | |
4 | 50 % | |
3 | 0 % | |
2 | 0 % | |
1 | 0 % |
Customer reviews
August 7, 2025
July 31, 2025
ngl, weak ideas are easier to skip and that is enough to keep testing it. It is one check, not the full trade.
Discussion
FAQ
Products available through cTrader Store, including trading bots, indicators and plugins, are provided by third-party developers and made available for informational and technical access purposes only. cTrader Store is not a broker and does not provide investment advice, personal recommendations or any guarantee of future performance.


Price
Since 22/06/2025
83
Sales
89
Free installs