
Açıklama
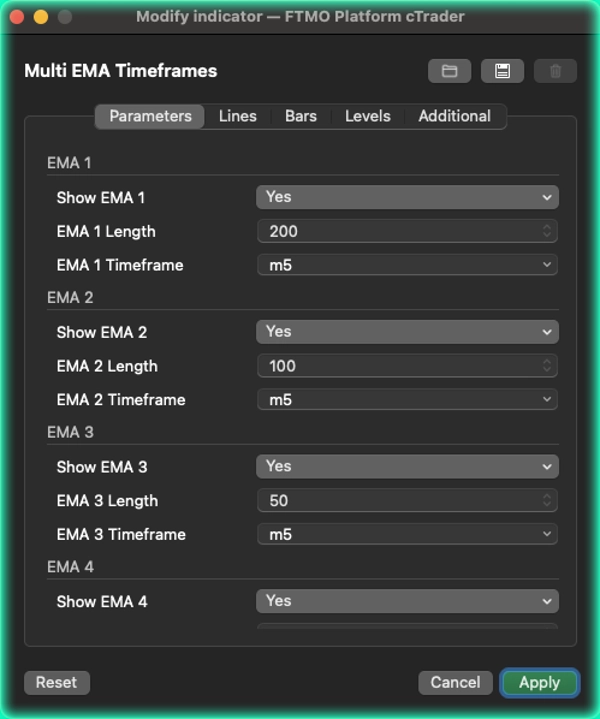
[BeyondTrading] tarafından Çoklu EMA Zaman Dilimleri Hareketli ortalamalarla ilgili en yaygın hata, önemli bir EMA'nın nerede olduğunu kontrol etmek için zaman dilimlerini değiştirmektir. Çoklu EMA Zaman Dilimleri bunu tamamen ortadan kaldırır. Çalıştığınız zaman diliminde kalırsınız — 5 dakikalık, 15 dakikalık, 1 saatlik — ve hangi zaman diliminden hangi EMA'nın şu anda grafiğinizde görünmesi gerektiğini tam olarak tanımlarsınız, hiçbir yere gitmeden.
5 dakikalık grafikteyseniz ve saatlik 200 EMA'yı görmek istiyorsanız? Tamam. Ayrıca 15 dakikalık 50 EMA ve mevcut zaman diliminden 20 EMA'yı yan yana görmek ister misiniz? O da tamam. Beş EMA'nın her biri tamamen bağımsız olarak yapılandırılır: kendi periyodu, kendi kaynak zaman dilimi, kendi rengi ve kendi açma/kapama düğmesi.
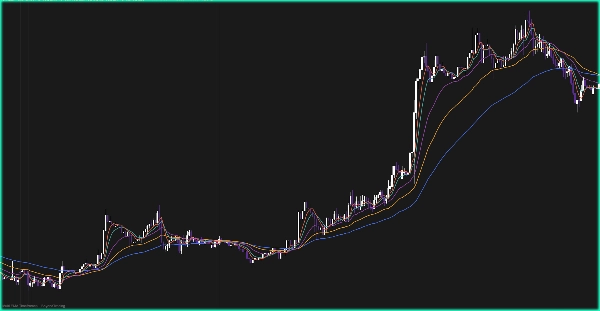
Bu, özellikle uyumlu kurulumlar için güçlüdür. Giriş zaman diliminizde fiyat, çok daha yüksek bir zaman dilimine ait bir EMA'ya yaklaştığında, o seviye gerçek yapısal ağırlık taşır. Bunu doğrudan grafiğinizde görmek — sekme değiştirmeden, tam değeri ikinci kez tahmin etmeden — bu önemli bölgelerle etkileşiminizi değiştirir.
İki çizim modu, çizgilerin nasıl çizileceğini kontrol etmenizi sağlar. Adım modu, her EMA'yı son tamamen kapanmış kaynak barında dondurur, böylece değer, daha yüksek zaman dilimi barı kapanana kadar değişmez — sıfır yeniden boyama, canlı ticaret kararları için tamamen güvenilir. Yumuşak mod, analiz ve inceleme için daha uygun, daha temiz bir görsel için kaynak barlar arasında sürekli enterpolasyon yapar.
Farkını yaratan nedir Çoğu çoklu EMA göstergesi her şeyi grafiğin mevcut zaman diliminde hesaplar. Burada, her EMA gerçekten kendi bağımsız zaman diliminden alınır. Yaklaşım yapmıyorsunuz — o zaman dilimindeki traderların gerçekten gördüğü gerçek EMA'yı okuyorsunuz.
Özellikler
- Kendi zaman dilimi ve periyoduna sahip, tamamen bağımsız 5 adede kadar EMA
- Herhangi bir grafikte kalırken, EMA'ları başka herhangi bir zaman diliminden okuyabilme
- Adım modu: değerler kapalı kaynak barlarına kilitlenir, yeniden boyama yok
- Yumuşak mod: akıcı görsel geçişler için lineer enterpolasyon
- Grafiğinizi her zaman temiz tutmak için EMA başına göster/gizle düğmesi
Özet
Müşteri değerlendirmeleri
5 | 50 % | |
4 | 50 % | |
3 | 0 % | |
2 | 0 % | |
1 | 0 % |


