Description
Every trend has a ceiling. Exhaustion Hunter identifies that ceiling in real time — and signals the exact moment it cracks. Built on a dual Williams %R system, it waits for both the fast and slow periods to confirm an extreme zone before anything prints. No guessing, no early entries. Just the signal, when the conditions are truly met.
Why exhaustion zones change everything
Reaching an extreme isn't a signal. Leaving it is. That single distinction separates entries with edge from entries that get hunted. Exhaustion Hunter's slow period acts as the structural baseline — the level where sustained directional conviction lives. The fast period is the trigger. When both collapse simultaneously, the move has genuinely run out of fuel. That's your window.
Features
- Dual %R confirmation — Fast and Slow periods must agree before a zone activates
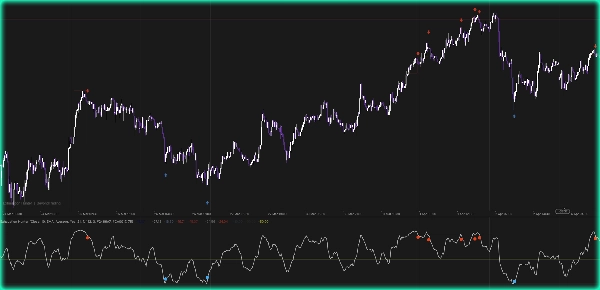
- Reversal arrows — fire the moment the zone breaks, never before
- Dynamic chart boxes — colored zones drawn directly on price during active conditions
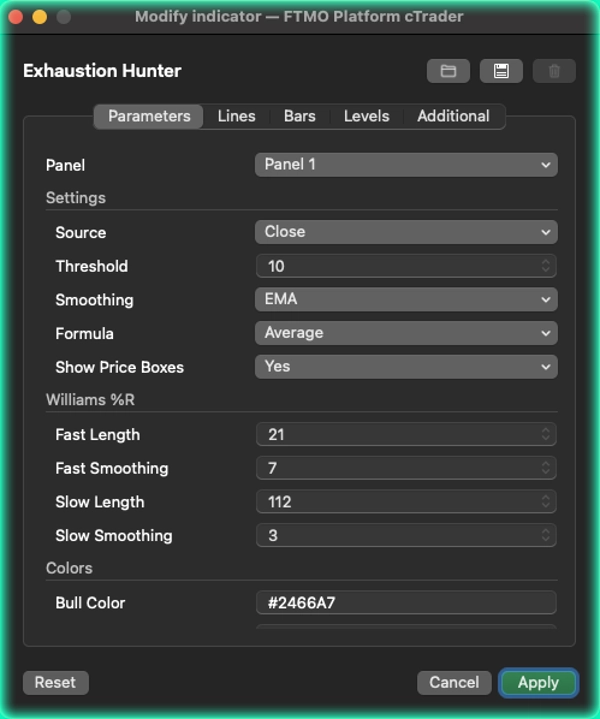
- 4 smoothing modes — SMA, EMA, WMA, RMA to tune signal responsiveness
- Formula toggle — dual confirmation or average mode
- Fully configurable — thresholds, colors, periods, source price
Summary
Key features include:
- Dual %R confirmation: Both fast and slow periods must align to activate a zone.
- Reversal arrows: Signals appear precisely when the exhaustion zone breaks.
- Dynamic chart boxes: Colored zones are drawn on the price chart during active conditions.
- Four smoothing modes: SMA, EMA, WMA, and RMA to adjust signal responsiveness.
- Formula toggle: Allows switching between dual confirmation and average mode.
- Full configurability: Users can customize thresholds, colors, periods, and source price.
Exhaustion Hunter helps traders identify when a price move has lost momentum, providing visual cues directly on the chart to assist in timing reversals. It supports customization to fit different trading styles and preferences.


!["[Hamster-Coder] Pivot Points MTF" logo](https://cdn.ctrader.com/image/webp/4c143e5a-309c-40e3-a578-f04d1e133ffa_31159)