"Pattern Scanner" logo
Pattern Scanner
4.0
Reviews: 1
"Pattern Scanner" uploaded image
42.1M
Traded volume
6.13M
Pips won
145
Sales
5.99K
Free installs

PatternScanner – Automatic Chart Pattern Detector for cTrader

PatternScanner is a visual chart-pattern detector for cTrader that automatically finds the most important classical reversal structures and draws them directly on your chart.

Instead of manually searching for patterns bar by bar, the indicator scans swing highs and lows in real time and highlights:

  • Head & Shoulders (H&S) – bearish
  • Inverse Head & Shoulders (INV H&S) – bullish
  • Double Top (DT) – bearish
  • Double Bottom (DB) – bullish
  • Wolf Ears (WOLF) – a “double–top style” pattern with a slightly higher second peak

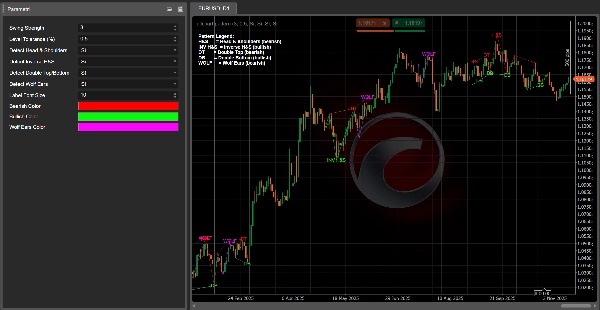
Each pattern is marked with a label (H&S, INV H&S, DT, DB, WOLF) and a set of lines that outline the structure, so you can see the pattern at a glance without guesswork.


Key Features

  • ✅ Automatically detects swing highs and lows and builds patterns from them
  • ✅ Identifies Head & Shoulders and Inverse Head & Shoulders with a drawn neckline
  • ✅ Detects Double Tops / Double Bottoms and connects the two key highs/lows
  • ✅ Recognizes Wolf Ears without overlapping the standard Double Top signal
  • ✅ Draws zig-zag lines between swing points to visually outline each pattern
  • ✅ Built-in legend in the top-left corner explaining all pattern codes (H&S, INV H&S, DT, DB, WOLF)
  • ✅ Fully overlay – everything is drawn on the price chart, no extra sub-window needed


Inputs / Parameters

  • Swing Strength – Number of bars used to confirm a swing high/low (pivot sensitivity).
  • Level Tolerance (%) – How similar two highs/lows must be to be considered “at the same level”.
  • Detect Head & Shoulders – Enable/disable H&S detection.
  • Detect Inverse H&S – Enable/disable inverse H&S detection.
  • Detect Double Top/Bottom – Enable/disable DT/DB detection.
  • Detect Wolf Ears – Enable/disable Wolf Ears detection.
  • Label Font Size – Size of the on-chart pattern labels.
  • Bearish Color – Color used for bearish patterns (H&S, DT, WOLF).
  • Bullish Color – Color used for bullish patterns (INV H&S, DB).
  • Wolf Ears Color – Dedicated color for the WOLF pattern lines and label.


How It Draws the Patterns

  • Head & Shoulders / Inverse H&S
    • Zig-zag line through the 5 key swing points (shoulder – head – shoulder).
    • Neckline drawn as a dotted trendline between the two lows (for H&S) or two highs (for inverse H&S).
  • Double Top / Double Bottom
    • A label (DT or DB) at the second top/bottom.
    • A trendline connecting the two highs (DT) or two lows (DB).
  • Wolf Ears
    • Zig-zag through the High–Low–High structure.
    • Dotted resistance line through the two peaks.
    • Wolf Ears is only signaled when the second high is clearly higher than the first, so it doesn’t overlap with a normal Double Top.


How to Use

Attach PatternScanner to any symbol and timeframe and let it act as a visual radar for major reversal structures:

  • Spot potential reversal zones around H&S, DT/DB and WOLF patterns
  • Combine with your own filters (trend, volume, support/resistance) for trade entries
  • Use the legend in the top-left corner to quickly read what pattern is being shown

It’s not a standalone trading system, but a powerful pattern-recognition tool that saves you time and helps you focus on the most interesting structures on the chart.


👉 Join our community

Inside the server you’ll find:

  • Support for this and my other cTrader indicators/cBots
  • Strategy discussion, pattern examples and optimization ideas
  • Updates, news and future tools I release


Indicator profile
4.0
Reviews: 1
5
0 %
4
100 %
3
0 %
2
0 %
1
0 %
Customer reviews
November 24, 2025
Pattern Scanner spots the key reversal chart patterns (H&S, Inverse H&S, Double Tops/Bottoms, Wolf Ears) with clean visuals and real-time updates. A great time-saver for pattern traders, enabling quicker identification of structure. Not a standalone signal tool - needs filtering and context. Strong tool for the toolkit.
Signal
Indices
Commodities
GBPUSD
MACD
Bollinger
Scalping
Supertrend
AI
XAUUSD
NAS100
BTCUSD
Forex
Breakout
RSI
EURUSD
NZDUSD
Fibonacci
Martingale
VWAP
Prop
ZigZag
ATR
SMC
Crypto
Grid
Stocks
Fair Value Gap (FVG)
USDJPY
Products available through cTrader Store, including trading bots, indicators and plugins, are provided by third-party developers and made available for informational and technical access purposes only. cTrader Store is not a broker and does not provide investment advice, personal recommendations or any guarantee of future performance.

More from this author

Read aggressive flow in real time. Flexible resets (Day/Week/Month), optional EMA smoothing, and non-repainting cumulati
The Prop-Ready Bot The Definitive Automaton for Challenges 🛡️ V2.0
Editions: Free (core VWAP + bands) · Pro (multi‑VWAP, click‑to‑anchor, alerts).
A price-action-first algorithm to trade Breakout, Approach, and Return around prior High/Low levels—with Prop-style risk
Volume Bubbles is a lightweight yet powerful visual indicator for cTrader
The Elliott Wave Pro Bot is a sophisticated and highly configurable algorithmic trading system
N.B.: Results with an initial invested capital of 100 euros.
AILevelTrader — Multi-AI Consensus Trading Bot 11 AI providers. One consensus. Prop Firm Ready.
1.9
Profit factor
4%
Max drawdown
Want a cBot based on this indicator? Contact us!
✅ Buy 3 prop accounts and manage just 1: cut management effort by 66% with a professional tool.
ZigZag Free is a clean swing-detection tool that marks significant pivot highs/lows
Breakout scalping with prop-firm grade equity control.

You may also like

Stochastic RSI
The Fair Value Gap (FVG) Indicator identifies inefficiencies in price action where an imbalance occurs due to aggressive
🧠Visually marks momentum zones when the RSI crosses the overbought/oversold thresholds (default 70/30). ✅
🚀 Simplify Your Trading Decisions With Powerful Technical Analysis.
xhobaniFX_ADR-Lines: Average Daily Range Horizontal Lines
Support and Resistance Line Indicator with Higher Timeframe Filter
Multi-timeframe version of the Quantitative Qualitative Estimation (QQE) indicator.
The EMA Trend Simple is a trend-following tool designed for simplicity and visual clarity.
Deep Mood Distribution (DMD) is a segmented volume-profile and sentiment tool that analyzes price action in fixed bar bl
Boost trading with Divergency ! Spot divergences & trends with 12 oscillators. Enjoy for Free... and with CS !🚀
Multi-Timeframe Rolling Volatility Indicator - Smart Volatility Breakout System
Custom ADX Indicator for precise trend analysis. المؤشر المخصص ADX لتحليل الاتجاه بدقة
📊 Smart Floating Risk Ultimate.Transform Your Risk Management with Real-Time Intelligence.
Advanced EMA indicator with dynamic color trend, slope strength & smart filters for clean, high-probability trading sign
Automatically plots fractal high and low lines on your chart so you always have clean, reliable structure levels.
This Indicator will show you Direction, Distance, and Time;
10 configurable moving averages: choose type, period, color per line; single price source for all.
Personal trade tracker for a single symbol. Clear net profit summary — FreshNet, ManageNet, DayNet, WTDNet, MTDNet.
42.1M
Traded volume
6.13M
Pips won
145
Sales
5.99K
Free installs