Description
Efficiency-based moving average that adjusts smoothing speed dynamically based on market conditions.
Calculates smoothing via Efficiency Ratio (directional movement vs. total volatility), responding quickly in trends and flattening during noise to avoid whipsaws.
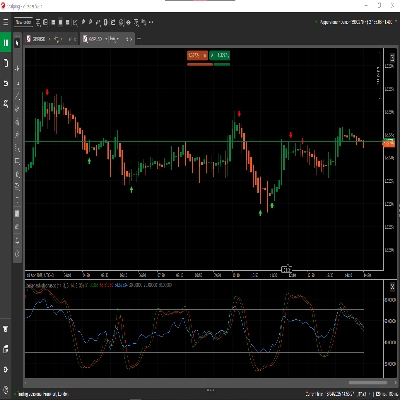
Three-state color visualization (Green uptrend, Red downtrend, Light Blue ranging), configurable sensitivity parameters (Period, Fast/Slow smoothing, ER threshold), automatic switching between fast and slow modes, and dynamic support/resistance behavior deliver adaptive trend tracking for traders needing responsiveness in directional markets and stability during consolidation.
FEATURES
Adaptive Algorithm
- Smoothing speed changes based on Efficiency Ratio (ER)—the ratio of directional movement to total volatility
- Responds quickly when efficiency increases
- Flattens when price is noisy to avoid whipsaws
- Dynamic distance from price based on market behavior
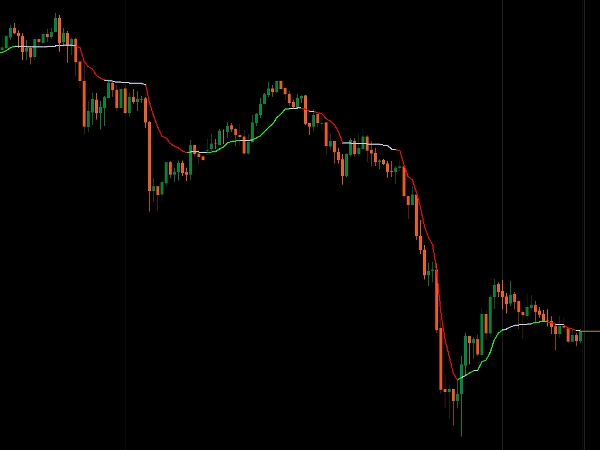
Three-State Visualization
- Green: Strong uptrend (ER above threshold + rising)
- Red: Strong downtrend (ER above threshold + falling)
- Light Blue: Ranging/choppy (ER below threshold)
- Instant visual confirmation of market conditions
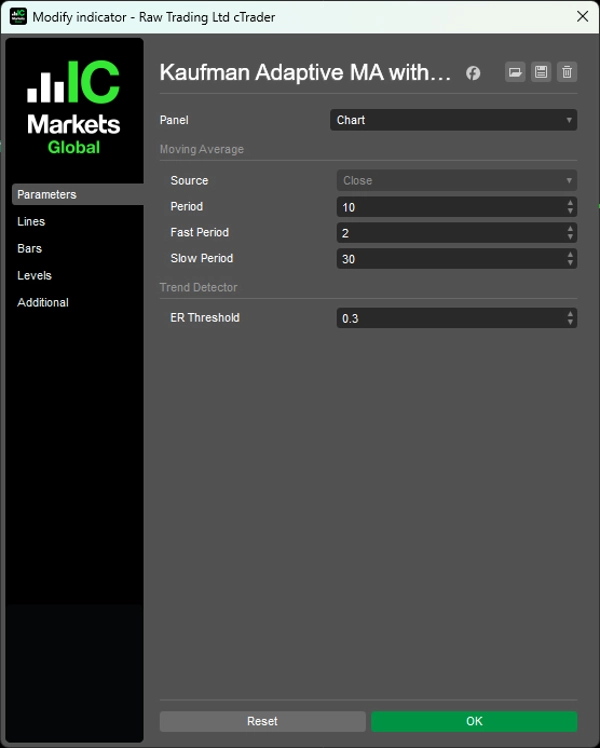
Configurable Sensitivity
- Period: Lookback for efficiency calculation (default: 10)
- Fast Period: Smoothing in strong trends (default: 2)
- Slow Period: Smoothing in ranging markets (default: 30)
- ER Threshold: Minimum efficiency to qualify as trending (default: 0.3)
Smart Adaptation
- Automatically switches between fast and slow smoothing
- Filters noise in choppy markets
- Catches trends early when conditions shift
- Works as dynamic support/resistance
__________________________________________________________________________________________
MORE FREE INDICATORS
Explore a wide range of market analysis tools—from structure and volume to regression, volatility, and custom timeframes.
Source code is available on GitHub repository.
All free to use. But if you feel like sending coffee support, you can route it here.
Support/Resistance
Volume
- Volume Activity Profiler
- Volume Efficiency Analyzer
- Volume Profile Analytics
- Volume Profile - Updated
- Volume Spread Analysis
- VWAP (Volume Weighted Average Price)
Moving Averages
- SSL Channel
- Anchored Moving Average
- Deviation-Scaled Moving Average
- Gann High Low Activator
- Instantaneous Trendline
- Kaufman Adaptive MA with Trend Vision
- Moving Average Channel
- Moving Averages Suite
- Trend Channel Moving Average
Utilities/Custom
Regression-Based
Volatility
Oscillators
__________________________________________________________________________________________
DISCLAIMER
Trading involves risk. This indicator is intended for technical analysis only — always apply proper risk management and trade responsibly.
FEECBACK & IMPROVEMENTS
If you have suggestions, feature requests, or ideas for enhancement, please leave a comment in the Discussion tab. Your feedback helps improve the indicator for everyone.
Summary
Key features include a three-state color-coded visualization: green for strong uptrends, red for strong downtrends, and light blue for ranging or choppy markets, providing immediate visual insight into market states. Users can configure sensitivity parameters such as lookback period, fast and slow smoothing periods, and the ER threshold to tailor responsiveness.
The indicator automatically switches between fast and slow smoothing modes, adapting to changing market behavior. It also acts as a dynamic support and resistance tool, helping traders identify trend shifts early while filtering out noise in consolidation phases. This adaptive approach supports scalping and other trading strategies requiring both responsiveness and stability in directional and ranging markets.


!["Smart Money Concepts (SMC) [Iridio Capital]" logo](https://cdn.ctrader.com/image/webp/28b69fd1-ef54-4bed-9487-07e78e883be4_40934)