

Description
MA-based trend activation with multi-timeframe modes and trendline projection.
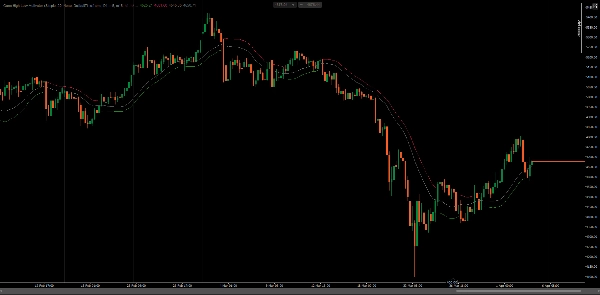
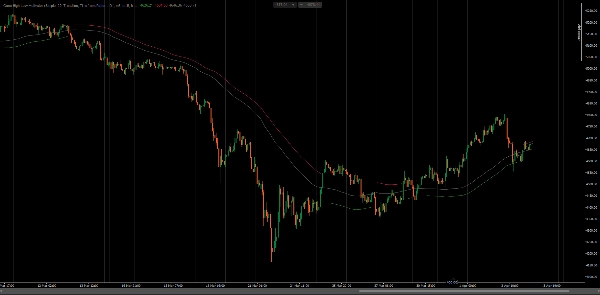
Tracks market direction by comparing close price against moving averages of High and Low across a configurable period. Switches state when close crosses above MA(High) into bullish or below MA(Low) into bearish — plotting the opposing band as the active support or resistance level.
Four calculation modes (None, Interpolated, ScaledPeriod, Trendline), Open and Close MA outputs, timeframe pattern resolution for automatic HTF selection, and trendline projection for next-bar estimation deliver a complete trend-following framework for traders working across multiple timeframes and analysis styles.
FEATURES
Core Activation Logic
- Bullish state: triggered when close crosses above MA(High) — plots MA(Low) as dynamic support
- Bearish state: triggered when close crosses below MA(Low) — plots MA(High) as dynamic resistance
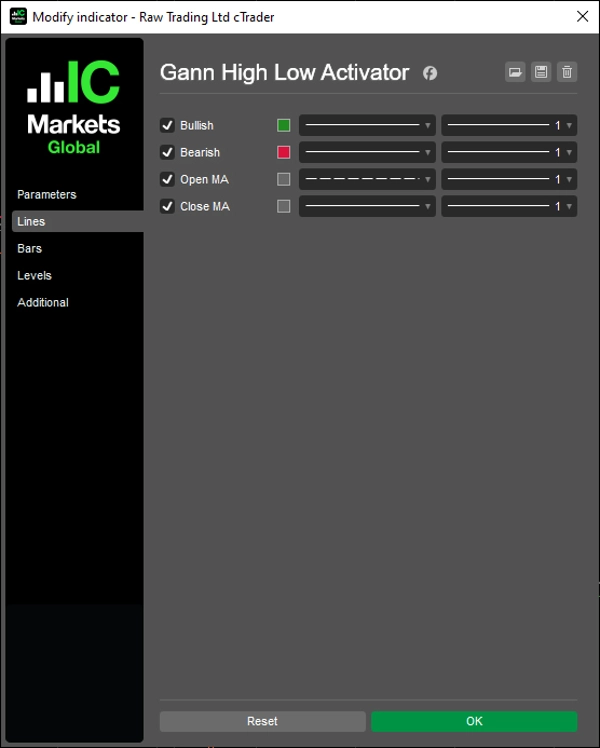
- Open MA and Close MA outputs for additional confluence and overlay analysis
- Supports all cTrader moving average types (SMA, EMA, DEMA, TEMA, WMA, etc.)
Multi-Timeframe Modes
- None: standard single-timeframe calculation on the current chart
- Interpolated: smooth HTF values linearly mapped onto LTF bars for continuous overlay
- ScaledPeriod: scales the period by HTF-to-LTF ratio — no extra data series required
- Trendline: draws chart trendline objects between HTF bar boundaries with full style control
Timeframe Resolution
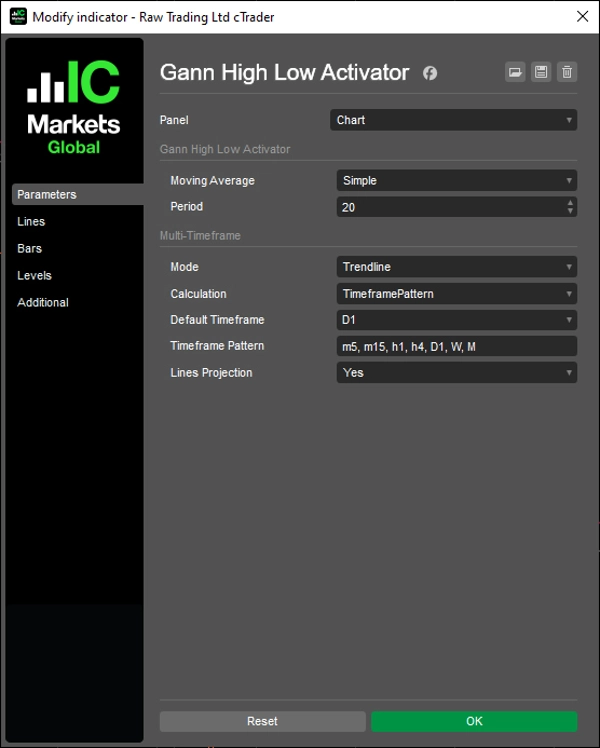
- DefaultTimeframe: manually select any HTF from the parameter dropdown
- TimeframePattern: auto-selects the nearest higher timeframe from a comma-separated token list (e.g.,
m5, m15, h1, h4, D1, W, M) - Pattern tokens support minutes (m1–m45), hours (h1–h12), days (d1–d3), weekly (W), and monthly (M)
Trendline Mode Extras
- Independent color, thickness, and style control per output line
- Visibility toggle rebuilds all segments automatically — no stale objects
- Projection segment extends the last HTF segment one bar forward for anticipation
Full Customization
- Configurable MA type and period
- Per-output line style inherited by trendline objects in Trendline mode
- Clean fallback to current timeframe when HTF ≤ chart timeframe
- Lines Length control for display range management
- On-chart UI panel for runtime parameter adjustment without opening settings
Lines Length
- Controls how far back lines are displayed — from Hour8 to Year10
Applies to all modes: series outputs and trendline objects
UI Controls
- On-chart combobox panel for quick access to MA Type, MTF Mode, Calculation, Timeframe, and Lines Length
- Configurable position: TopLeft, TopRight, BottomLeft, BottomRight, or hidden (None)
__________________________________________________________________________________________
MORE FREE INDICATORS
Explore a wide range of market analysis tools—from structure and volume to regression, volatility, and custom timeframes.
Source code is available on GitHub repository.
All free to use. But if you feel like sending coffee support, you can route it here.
Support/Resistance
Volume
- Volume Activity Profiler
- Volume Efficiency Analyzer
- Volume Profile Analytics
- Volume Profile - Updated
- Volume Spread Analysis
- VWAP (Volume Weighted Average Price)
Moving Averages
- SSL Channel
- Anchored Moving Average
- Deviation-Scaled Moving Average
- Gann High Low Activator
- Instantaneous Trendline
- Kaufman Adaptive MA with Trend Vision
- Moving Average Channel
- Moving Averages Suite
- Trend Channel Moving Average
Utilities/Custom
Regression-Based
Volatility
Oscillators
__________________________________________________________________________________________
DISCLAIMER
Trading involves risk. This indicator is intended for technical analysis only — always apply proper risk management and trade responsibly.
FEECBACK & IMPROVEMENTS
If you have suggestions, feature requests, or ideas for enhancement, please leave a comment in the Discussion tab. Your feedback helps improve the indicator for everyone.
Summary
Key features include four multi-timeframe calculation modes—None (single timeframe), Interpolated (smoothed higher timeframe values), ScaledPeriod (period scaled by timeframe ratio), and Trendline (trendline objects between higher timeframe bars with style control). It supports all cTrader MA types (SMA, EMA, DEMA, TEMA, WMA, etc.) and offers Open and Close MA outputs for additional analysis.
Timeframe resolution options allow manual or automatic selection of higher timeframes based on customizable token patterns. Trendline mode provides independent styling and projects the trendline forward by one bar for anticipation. The indicator includes extensive customization for MA type, period, line styles, display length, and an on-chart UI panel for runtime parameter adjustments. It is suitable for traders applying trend-following techniques across multiple symbols and timeframes.
Discussion
Customer reviews
FAQ
More from this author
















Price