
Description
OVERVIEW
Balance of Power indicator measures the strength of buyers versus sellers by assessing each side's ability to push prices to extreme levels.
Introduced by Igor Levshin in the August 2001 issue of Technical Analysis of Stocks & Commodities magazine, BOP calculates the ratio of price movement within each bar's range to reveal internal strength dynamics independent of price direction.
CONCEPT
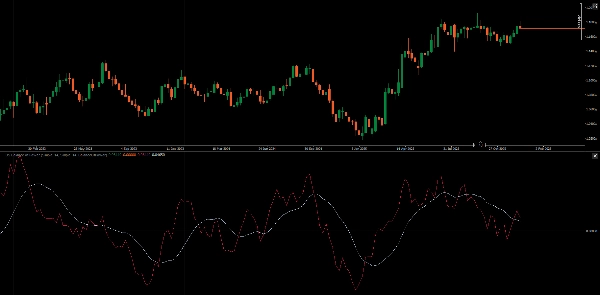
Balance of Power measures where price closes within each bar's range to reveal the internal battle between buyers and sellers.
The underlying principle is simple: buyers push prices toward the high, sellers push toward the low. Where price ultimately closes within that range reveals who dominated the trading period.
The raw values are smoothed using a moving average to reduce noise and reveal sustained directional pressure, transforming erratic bar-by-bar readings into a clean momentum gauge that tracks shifts in market control.
MARKET STRUCTURE APPLICATION
BOP provides internal strength analysis that can confirm or contradict price structure:
Trend Phase Identification
- Strong uptrend: BOP consistently above zero with higher lows
- Strong downtrend: BOP consistently below zero with lower highs
- Consolidation: BOP oscillating around zero line
- Transition zones: BOP breaking previous structure (higher high/lower low)
Support/Resistance Confluence
- BOP returning to zero often coincides with price testing key levels
- BOP extreme readings (+0.8 to +1.0 or -0.8 to -1.0) may indicate exhaustion near structure
- Divergence at structure levels suggests potential rejection or breakthrough
Distribution/Accumulation
- Rising prices with declining BOP: potential distribution phase
- Falling prices with rising BOP: potential accumulation phase
- These divergences are most significant near major structure levels
MULTI-TIMEFRAME STRATEGY
Using BOP across timeframes provides context and precision:
1. Higher Timeframe (HTF) - Directional Bias:
- Daily/4H BOP above zero → seek buy opportunities on lower timeframes
- Daily/4H BOP below zero → seek sell opportunities on lower timeframes
- HTF BOP crossing zero → major trend shift, wait for confirmation
2. Lower Timeframe (LTF) - Entry Timing:
- 1H/15M BOP aligns with HTF → high-probability setups
- LTF BOP/Signal crossover in HTF direction → entry trigger
- LTF histogram expansion confirms momentum
3. Timeframe Alignment:
- All timeframes in agreement → strongest conviction trades
- HTF and LTF diverging → wait for resolution or avoid trade
- LTF reversal against HTF → potential counter-trend scalp only
SIGNAL LINE & HISTOGRAM
Signal Line (MA of BOP):
- BOP/Signal crossovers provide filtered entry/exit signals
- Signal line slope indicates momentum persistence
- Distance between BOP and Signal shows move extension
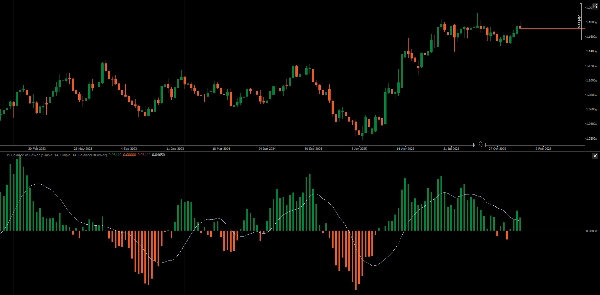
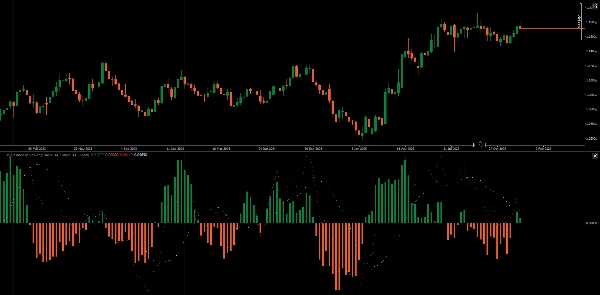
Histogram Modes:
- Value Mode: Shows BOP polarity relative to zero (buyer/seller dominance)
- Signal Mode: Shows BOP - Signal difference, revealing momentum shifts earlier than crossovers
In Signal mode, histogram zero-line crossovers occur before BOP/Signal line crossovers, offering early warning of momentum change.
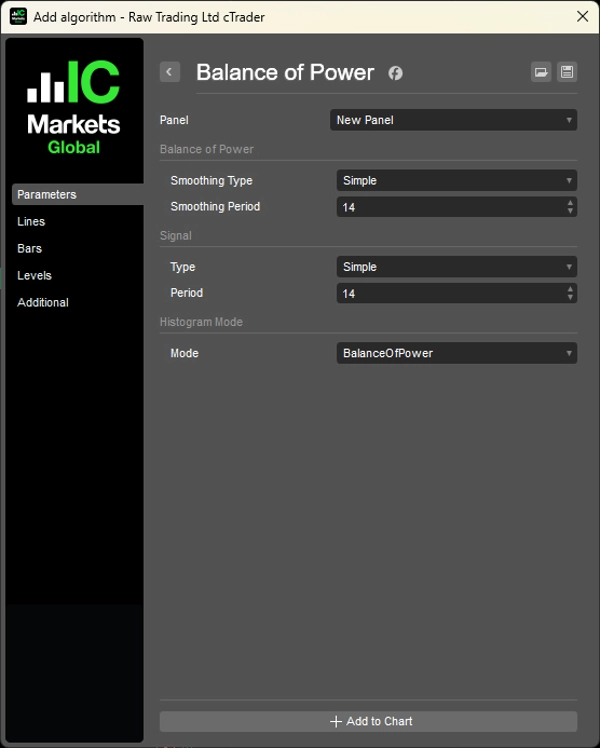
FEATURES
- Smoothing Period: Adjustable MA period for BOP (default 14)
- Smoothing Type: Choice of MA types (SMA, EMA, etc.)
- Signal Period: Adjustable MA period for Signal line (default 14)
- Signal Type: Choice of MA types for Signal line
- Histogram Mode: Toggle between Value and Signal difference display
PRACTICAL EXAMPLE
- HTF (Daily): BOP above zero and rising → bullish bias
- Price pulls back to support
- LTF (1H): BOP crosses above Signal → entry trigger
- Histogram (Signal mode) expands → confirms momentum acceleration
- Exit when LTF histogram contracts or BOP crosses below Signal
__________________________________________________________________________________________
MORE FREE INDICATORS
Explore a wide range of market analysis tools—from structure and volume to regression, volatility, and custom timeframes.
Source code is available on GitHub repository.
All free to use. But if you feel like sending coffee support, you can route it here.
Support/Resistance
Volume
- Volume Activity Profiler
- Volume Efficiency Analyzer
- Volume Profile Analytics
- Volume Profile - Updated
- Volume Spread Analysis
- VWAP (Volume Weighted Average Price)
Moving Averages
- SSL Channel
- Anchored Moving Average
- Deviation-Scaled Moving Average
- Gann High Low Activator
- Instantaneous Trendline
- Kaufman Adaptive MA with Trend Vision
- Moving Average Channel
- Moving Averages Suite
- Trend Channel Moving Average
Utilities/Custom
Regression-Based
Volatility
Oscillators
__________________________________________________________________________________________
DISCLAIMER
Trading involves risk. This indicator is intended for technical analysis only — always apply proper risk management and trade responsibly.
FEECBACK & IMPROVEMENTS
If you have suggestions, feature requests, or ideas for enhancement, please leave a comment in the Discussion tab. Your feedback helps improve the indicator for everyone.
Summary
Key functionalities include identifying trend phases—strong uptrends, downtrends, consolidation, and transition zones—by observing BOP behavior relative to the zero line. It also aids in detecting support and resistance confluence, with extreme BOP readings indicating potential exhaustion near key levels and divergences signaling possible rejections or breakthroughs. The indicator helps identify distribution and accumulation phases through price and BOP divergences.
BOP supports multi-timeframe analysis: higher timeframes provide directional bias, while lower timeframes offer entry timing signals via BOP and signal line crossovers and histogram momentum confirmation. The signal line is a moving average of BOP, with crossovers serving as filtered entry/exit triggers. The histogram can display either BOP polarity or the difference between BOP and its signal line, offering early momentum shift warnings.
Adjustable parameters include smoothing periods and types for both BOP and signal lines, and histogram display modes. The indicator is applicable across Forex, indices, commodities, cryptocurrencies, and stocks markets.


