Brokers & props
For business
00
Days
:
00
Hours
:
00
Minutes
:
00
Seconds
Indicator
Indices
Commodities
Stocks
Forex
Crypto
Deviation-Scaled Moving Average
5.0
24/12/2025
18
Desktop
Since 20/12/2024
Free installs
1369
"Deviation-Scaled Moving Average" uploaded image"Deviation-Scaled Moving Average" uploaded image

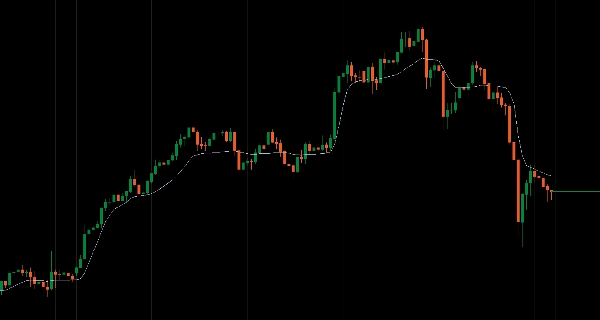
Momentum-adaptive MA that scales responsiveness dynamically based on normalized price deviation.


Alpha adjusts based on deviation strength rather than fixed periods, becoming fast and reactive during trends while remaining smooth and stable during consolidation with zero-lag breakout response.

SuperSmoother 2-pole filter for noise elimination, RMS normalization ensuring consistent behavior across volatility regimes, smart early-bar handling with EMA fallback for stable initialization, automatic alpha calculation (0.001-0.999 range), and single period parameter configuration deliver adaptive trend tracking for traders needing responsiveness in directional markets without whipsaws during consolidation.


FEATURES


Momentum-Adaptive Calculation

  • Alpha adjusts dynamically based on normalized price deviation, not fixed periods
  • Becomes fast and reactive during strong trends
  • Smooth and stable during consolidation
  • Zero lag on breakouts: Responds instantly when price shows genuine directional conviction


SuperSmoother Filtering

  • Advanced 2-pole filter eliminates noise while preserving genuine momentum signals
  • Clean trend identification without high-frequency whipsaws
  • Maintains signal integrity across different market conditions


RMS Normalization

  • Deviation scaled by Root Mean Square
  • Ensures consistent behavior across volatility regimes
  • Adapts to different market environments automatically


Smart Early-Bar Handling

  • Falls back to simple EMA during warmup period for stable initialization
  • Rock-solid stability with built-in NaN/infinity protection
  • Reliable calculation from the first bar


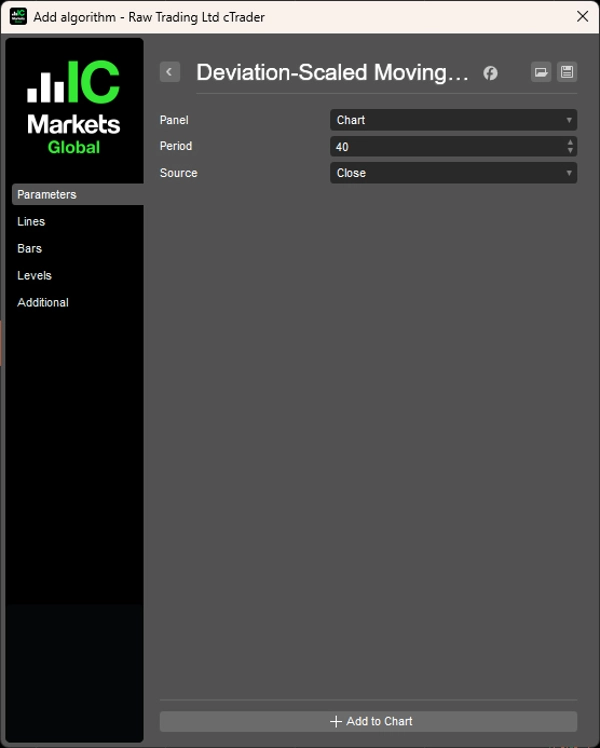
Simple Configuration

  • Single period parameter (default 40)
  • Automatic alpha calculation (0.001 to 0.999 range)
  • Overlay indicator—plots directly on price chart
  • No complex settings required


__________________________________________________________________________________________


MORE FREE INDICATORS


Check out my other indicators—each one built with production-level code quality and practical features traders actually need.

All free to use. But if you feel like sending coffee support, you can route it to tinyurl(dot)com/coffee-supply


Support/Resistance


Volume


Moving Averages


Utilities/Custom


Regression-Based


Volatility


Oscillators


__________________________________________________________________________________________


DISCLAIMER

Trading involves risk. This indicator is intended for technical analysis only — always apply proper risk management and trade responsibly.


FEECBACK & IMPROVEMENTS

If you have suggestions, feature requests, or ideas for enhancement, please leave a comment in the Discussion tab. Your feedback helps improve the indicator for everyone.

5.0
Reviews: 1
5
100 %
4
0 %
3
0 %
2
0 %
1
0 %
Customer reviews
November 24, 2025
Deviation-Scaled MA adapts dynamically to volatility, reacting faster in active markets and smoothing out in quieter ones. A clean, stable, and responsive trend tool that outperforms classic EMA/SMA in shifting conditions. Great for scalping and swing filters alike. Alerts and trend-color modes would make it even stronger.
More from this author
VWAP (Volume Weighted Average Price)
Customizable VWAP with flexible reset, three band methods, and full Fibonacci level control.
Fair Value Gap
FVG Detector: Identify and label Fair Value Gaps, with age, status & multi-timeframe support.
Indicator
Fibonacci
Simple Pivot Points
Clear pivot levels. Clean S/R zones. Five methods. Any timeframe.
Volume Profile Analytics
Volume distribution analysis with Market Profile TPO integration.
Indicator
FVG
Fibonacci
Fair Value Gap (Extended)
Detect FVGs with age, status, Fibonacci levels, and customizable fill threshold—extended version.
Indicator
Breakout
Higher Timeframe Candlestick
Overlay a real-time higher-timeframe candle on your chart — color-coded bias without switching TFs.
Indicator
Breakout
Round Number
Plots automatic psychological levels at round-number zones – major structure & liquidity levels.
Indicator
Breakout
Fibonacci
Linear Regression Channel
Statistically-grounded trend channels via linear regression — clear trend & reversal zones.
Indicator
Indices
Stocks
Commodities
+2
Custom Timeframes
Custom and native timeframes display with OHLC lines, moving averages, and Fibonacci levels.
Indicator
Bollinger
Trend Channel Moving Average
Complete MA-channel system: colored trend, channel boundaries & equilibrium with 6 Fib zones.
Indicator
Breakout
Fibonacci
Initial Balance
Track Initial Balance ranges across any period with optional Fibonacci levels and projections.
Indicator
Indices
Commodities
Stocks
+2
Moving Averages Suite
28-method MA library in one indicator — from classic EMAs to adaptive & zero-lag variants.
Indicator
Scalping
Nadaraya-Watson Kernel Regression
Ultra-smooth adaptive trend line via Gaussian kernel regression — low lag, clean structure.
Indicator
Scalping
Kaufman Adaptive MA with Trend Vision
Adaptive KAMA: fast in trend, slow in noise — with color-coded market state visualization.
Indicator
Indices
Stocks
Commodities
+2
Moving Average Channel
Price channel system built on moving averages—track trend direction, momentum shifts, and mean reversion zones.
Indicator
Breakout
ATR
Scalping
Trend Volatility Trail
A volatility-adaptive trend-following indicator that dynamically adjusts to market conditions.
Indicator
Fibonacci
Advanced Regression Channel
Regression channels with Fibonacci levels across multiple regression types, timeframes, and custom date ranges.
Indicator
Fibonacci
Anchored Moving Average
Anchor a moving average to any point on the chart and watch it extend dynamically as price evolves.
You may also like
Break of Structure
The Break of Structure (BoSCHoCh) Indicator is a smart market structure tool designed to help traders easily spot trend.
Market_Session_Forex
Market Sessions
Indicator
Grid
RSI
Breakout
+19
Buy and sell indicator
Buy and Sell Signals
Indicator
Forex
Signal
USDJPY
Yen Strength - Line Momentum
Single-line JPY Strength Indicator: Track yen momentum swiftly across key pairs—achieve clarity in your forex trades!
KDJ
The KDJ oscillator display consists of 3 lines (K, D and J - hence the name of the display) and 2 levels.
Fx4U.Multi Trend Line Indicator
Allow trader to draw multi trendlines in different timeframes on one chart,Give trader an overview of the current market
Indicator
RSI
Breakout
Signal
+1
ZScore
Z-Score measures price deviation from its average, helping identify extremes, trends, and trading opportunities ........
Indicator
Signal
MACD
TradingViewMACD
Enhance your trading strategy with our customizable TradingViewMACD indicator. Optimize and elevate your market analysis
Indicator
Indices
Breakout
XAUUSD
+3
AnchoredVWAP
A precision overlay tool that combines session-aware VWAP logic and standard deviations.
Indicator
Grid
NAS100
NZDUSD
+16
AllPattern
🔍 Discover All Candlestick Patterns… Absolutely Free!
Indicator
Indices
MFI-MTF
MFI- MTF is a multi-timeframe momentum indicator that brings higher timeframe perspective to your current chart
Indicator
NAS100
NZDUSD
Martingale
+22
Indicators Volume Profile 1
Taiz Pro Volume Profile مؤشر احترافي لتحليل الحجم (Volume Profile) يكشف عن مناطق الدعم والمقاومة الحقيقية التي يركز عليه
Indicator
Indices
Breakout
Stocks
+2
VegaXLR - cTrader Pitchfork & Channel Enhancer
Enhance Pitchfork & Price Channels in cTrader with customizable Equidistant and Fibonacci levels.
Indicator
NAS100
NZDUSD
Breakout
+17
OHLC and SMC - Market Structure
Multi-TF OHLC, NY Midnight, ZigZag & Gann S/R—clean visuals for SMC, scalping, and intraday precision.
Indicator
Grid
NAS100
NZDUSD
+19
Trend Cycle
Trend Cycle – measure the life of your trends. See how long the current move has been running and how long similar trend
Indicator
Breakout
3 Bar Triangle by Linda Raschke
3 bar triangle = high below 2 day high, low above 2 day low
Indicator
NAS100
RSI
NZDUSD
+18
QX Heatmap Scanner
Multi-timeframe heatmap scoring Direction, Strength & Volatility at a glance!