
Description
OVERVIEW
Foundation: Wyckoff Principles
This indicator is built upon two complementary concepts from Wyckoff methodology:
1. Effort vs Result
The core Wyckoff principle states that price movement (result) should be proportional to the volume behind it (effort). When effort and result are in harmony, the market is behaving normally. When they diverge, it signals potential turning points or continuation strength.
This indicator directly implements this through the Efficiency metric (result per unit of effort) and its inverse, Absorption (effort not translating into result).
2. Spread Analysis
Wyckoff also emphasized analyzing the character of individual price bars—examining the spread (range), where price closed within that range, and whether the bar showed commitment or indecision.
This indicator implements spread analysis through Conviction (directional commitment), Wasted Ratio (retracement within the bar), and Close Position (used to contextualize absorption as accumulation or distribution).
WHAT THIS INDICATOR DOES
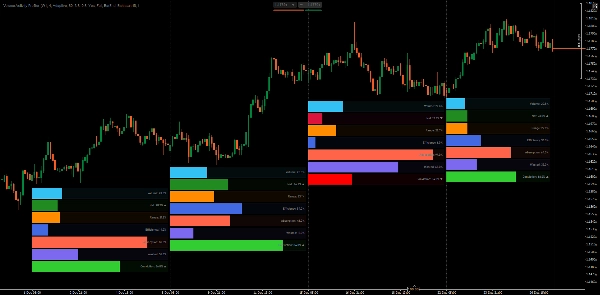
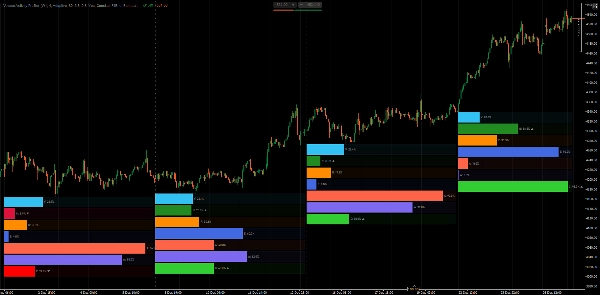
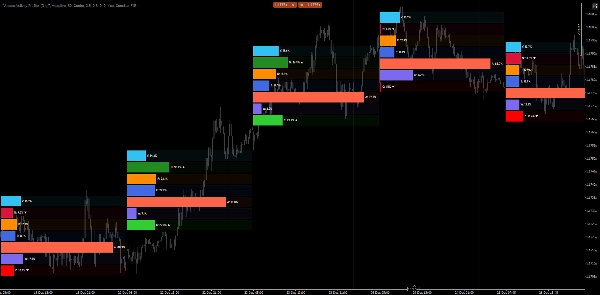
Volume Activity Profiler analyzes price bars from a selected timeframe and breaks down their activity into measurable components. It calculates both raw metrics and derived percentile-based metrics, then displays them as horizontal bar graphs anchored below each analyzed bar.
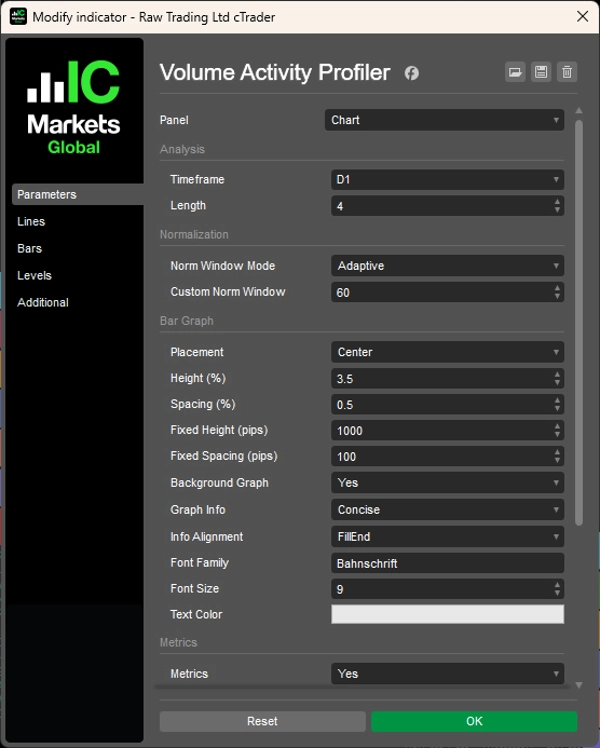
You configure two main parameters:
- Timeframe: The timeframe to analyze (e.g., Weekly, Daily, H4)
- Length: How many bars to profile (e.g., last 4 bars)
The indicator then profiles each bar within that scope, calculating metrics and ranking them against each other and against historical norms.
METRICS EXPLAINED
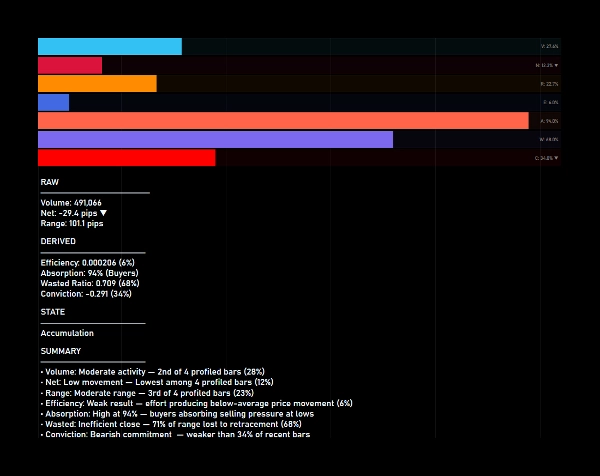
Raw Metrics (proportion-based among profiled bars):
1. Volume
Tick volume of the bar. Shows what proportion of total profiled volume this bar represents.
2. Net
Directional movement (close − open) in pips. Shows proportion of total net movement. Color indicates direction (green = bullish, red = bearish).
3. Range
Total price range (high − low) in pips. Shows proportion of total range among profiled bars.
Derived Metrics (percentile-based against historical window):
1. Efficiency (Effort vs Result)
Range produced per unit of volume. High efficiency means effort is translating into price movement. Low efficiency suggests absorption or resistance.
2. Absorption (Effort vs Result)
Inverse of efficiency. High absorption indicates volume is being absorbed without proportional price movement—potential accumulation or distribution.
3. Wasted (Spread Analysis)
Percentage of range lost to retracement (range − net) / range. High waste means the bar gave back much of its movement. Low waste indicates a clean, directional bar.
4. Conviction (Spread Analysis)
Directional commitment measured as net/range. High conviction means the bar closed near its extreme. Low conviction indicates indecision or rejection.
UNDERSTANDING THE BAR GRAPHS
Each profiled bar displays 7 horizontal bars:
- Volume, Net, Range — Filled based on proportion among profiled bars
- Efficiency, Absorption, Wasted, Conviction — Filled based on percentile rank against historical data
A bar filled to 80% on Efficiency means this bar's efficiency is higher than 80% of bars in the normalization window.
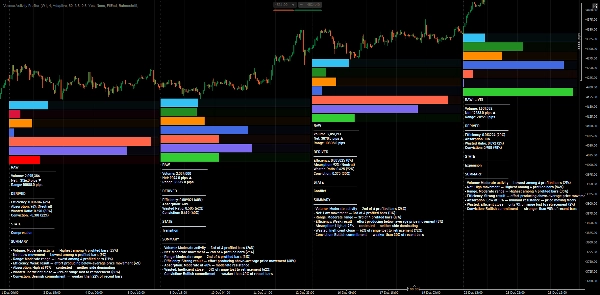
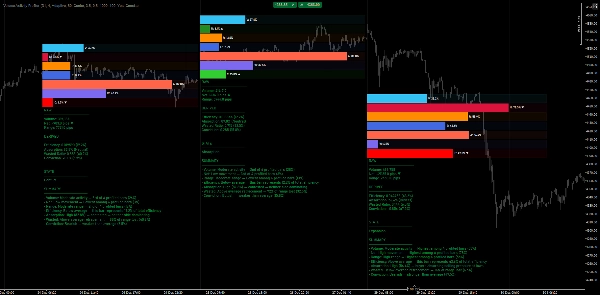
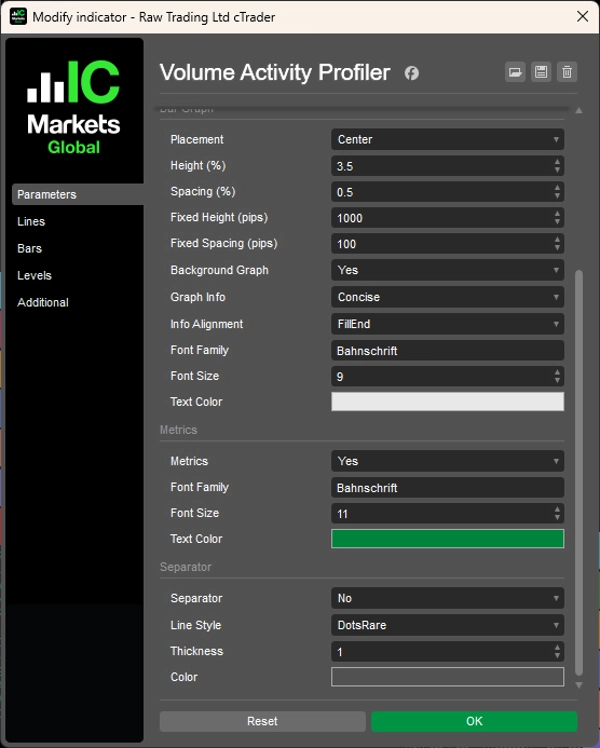
ACTIVITY STATE CLASSIFICATION
When Metrics display is enabled, the indicator classifies each bar into one of these states:
1. Compression
Low efficiency + low conviction — price is coiling, potential energy building
2. Expansion
High efficiency + high conviction + low waste — strong directional move
3. Conflict
High waste + low conviction — battle between buyers and sellers
4. Accumulation
High absorption + close near lows — buyers absorbing selling pressure
5. Distribution
High absorption + close near highs — sellers absorbing buying pressure
6. Rejection
High conviction but close opposite to direction — failed move, potential reversal
7. Transition
Mixed signals — market in transition between states
PRACTICAL BENEFITS
- Quick effort vs result assessment — Instantly see if volume is producing proportional movement or being absorbed.
- Multi-timeframe structure analysis — Analyze higher timeframe bars while staying on your execution timeframe.
- Identify accumulation/distribution — High absorption with close positioning reveals where large players may be active.
- Spot exhaustion and rejection — High conviction with opposing close position warns of potential reversals.
- Compare bars objectively — Rankings and percentiles remove subjectivity from "high" or "low" volume assessments.
- Confirm breakouts — Expansion state with high efficiency and conviction confirms genuine breakout interest.
TICK VOLUME AS EFFORT PROXY
This indicator uses tick volume as its effort input. In forex, tick volume represents price change frequency rather than actual traded volume—a known limitation of decentralized markets.
Despite this, tick volume effectively serves as an effort proxy because:
- It reflects relative market activity between bars
- High tick counts indicate increased participant engagement
- The effort vs result relationship holds—high activity producing little movement still signals absorption
The indicator's percentile rankings and bar comparisons remain valid as long as data is consistent.
NOTES
- The indicator uses adaptive normalization windows based on timeframe when set to Adaptive mode, ensuring relevant historical context.
- Percentile calculations update only on completed bars to avoid unstable readings on forming bars.
- The current forming bar is marked with [LIVE] in the metrics panel.
__________________________________________________________________________________________
MORE FREE INDICATORS
Explore a wide range of market analysis tools—from structure and volume to regression, volatility, and custom timeframes.
Source code is available on GitHub repository.
All free to use. But if you feel like sending coffee support, you can route it here.
Support/Resistance
Volume
- Volume Activity Profiler
- Volume Efficiency Analyzer
- Volume Profile Analytics
- Volume Profile - Updated
- Volume Spread Analysis
- VWAP (Volume Weighted Average Price)
Moving Averages
- SSL Channel
- Anchored Moving Average
- Deviation-Scaled Moving Average
- Gann High Low Activator
- Instantaneous Trendline
- Kaufman Adaptive MA with Trend Vision
- Moving Average Channel
- Moving Averages Suite
- Trend Channel Moving Average
Utilities/Custom
Regression-Based
Volatility
Oscillators
__________________________________________________________________________________________
DISCLAIMER
Trading involves risk. This indicator is intended for technical analysis only — always apply proper risk management and trade responsibly.
FEECBACK & IMPROVEMENTS
If you have suggestions, feature requests, or ideas for enhancement, please leave a comment in the Discussion tab. Your feedback helps improve the indicator for everyone.
Summary
The indicator profiles price bars over a user-selected timeframe and length, calculating raw metrics such as Volume (tick volume proportion), Net (directional price movement), and Range (price range). It also derives percentile-based metrics including Efficiency (price movement per volume unit), Absorption (volume without proportional price change), Wasted Ratio (retracement within the bar), and Conviction (directional commitment).
These metrics are visually represented as horizontal bar graphs beneath each analyzed bar, facilitating objective comparison and historical context. The indicator classifies bars into activity states like Compression, Expansion, Conflict, Accumulation, Distribution, Rejection, and Transition, aiding in identifying market phases and potential turning points.
Volume Activity Profiler uses tick volume as an effort proxy, reflecting relative market activity. It supports multi-timeframe analysis and updates percentile rankings on completed bars to ensure stable readings. This tool assists traders in assessing volume efficiency, spotting accumulation/distribution, confirming breakouts, and understanding market structure through quantitative volume and price bar analysis.
Customer reviews
5 | 100 % | |
4 | 0 % | |
3 | 0 % | |
2 | 0 % | |
1 | 0 % |


!["[CB] Pivot Points Pro" logo](https://cdn.ctrader.com/image/webp/43463c82-67b0-4f10-a4ba-901bba091d81_32594)


