Description
Trend Pullback Profiler
Trend Pullback Profiler is a cTrader indicator built to analyze how a trend breathes by measuring the depth and frequency of pullbacks – now also in Fibonacci retracement %.
Using an EMA-based trend filter, the indicator:
- detects when a clear uptrend or downtrend is in place;
- identifies each confirmed pullback within that trend;
- measures the pullback depth in pips;
- computes the Fibonacci-style retracement percentage relative to the last impulse leg;
- keeps live track of:
- how many pullbacks occurred in the current trend,
- the last pullback depth,
- the average pullback depth,
- the last Fibonacci retracement %.
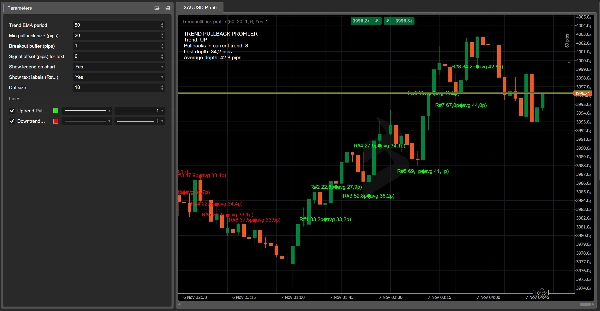
On the chart, it:
- plots a large green dot at the low of the pullback in an uptrend,
- a large red dot at the high of the pullback in a downtrend,
- optionally prints a compact label like:
22.5 p / 38.2%.
In the top-left corner, a dynamic legend displays:
- current trend direction (UP / DOWN / NONE);
- number of pullbacks in the current trend;
- last pullback depth (in pips);
- average pullback depth (in pips);
- last Fibonacci retracement percentage.
Key Parameters
- Trend EMA period
EMA period used to define trend direction. - Min pullback size (pips)
Minimum required pullback depth (in pips) to count as a valid retracement. - Breakout buffer (pips)
Extra distance price must move beyond the previous trend extreme to confirm a new leg and close the pullback. - Signal offset (pips) for text
Vertical offset for text labels relative to the pullback high/low. - Show legend on chart
Toggles the on-chart legend with trend, last and average metrics. - Show text labels near dots
If enabled, prints a small label next to the dot with pullback depth (and optionally Fibonacci %). - Show Fibonacci % in labels
If enabled, shows both pips and Fibonacci % in the label (XX.Xp / YY.Y%). - Dot size
Controls how big the dots appear on the chart, making pullbacks easy to spot even on lower timeframes.
Practical use cases
- Visually profiling how deep pullbacks usually are on a given symbol/timeframe.
- Planning limit entries around typical retracement zones instead of random levels.
- Spotting unusually deep pullbacks (for example, beyond 61.8% or 78.6%) that may signal trend exhaustion or a possible reversal.
- Adding objective, numeric pullback and Fibonacci information to your trend-trading playbook.
How Fibonacci retracement is calculated in Trend Pullback Profiler
Trend Pullback Profiler calculates the Fibonacci-style retracement percentage based on the last impulse leg of the trend, not on arbitrary highs and lows.
In an uptrend
- The indicator tracks an impulse leg from:
- Trend base price = last significant low (end of the previous pullback)
- Trend extreme = last swing high of the trend
- When a pullback forms, the indicator measures:
- Depth of the pullback (price):
depthPrice = trendHigh – pullbackLow - Size of the impulse leg:
legSize = trendHigh – trendBasePrice
- Depth of the pullback (price):
- The Fibonacci retracement percentage is:
Fib% = (depthPrice / legSize) * 100
So if price falls back roughly 38.2%–50% of the last impulse before continuing up, you’ll see values close to 38.2%, 50%, 61.8%, etc.
In a downtrend
- The impulse leg runs from:
- Trend base price = last significant high (end of the previous pullback)
- Trend extreme = last swing low of the trend
- The pullback goes up against the trend, and the indicator measures:
- Depth of the pullback (price):
depthPrice = pullbackHigh – trendLow - Size of the impulse leg:
legSize = trendBasePrice – trendLow
- Depth of the pullback (price):
- Same formula:
Fib% = (depthPrice / legSize) * 100
This way, every dot you see on the chart represents a pullback inside a clear impulse of the current trend, expressed both in pips and in Fibonacci %, so you can quickly judge if a retracement is shallow, typical, or unusually deep.
Summary
Key features include:
- Detection of trend direction and pullbacks.
- Measurement of pullback depth and Fibonacci retracement percentage.
- Live tracking of the number of pullbacks, last pullback depth, average pullback depth, and last Fibonacci retracement percentage.
- Visual chart elements such as large green dots at pullback lows in uptrends and large red dots at pullback highs in downtrends.
- Optional compact labels displaying pullback depth and Fibonacci percentage.
- A dynamic legend showing current trend direction, pullback counts, and metrics.
The Fibonacci retracement is calculated based on the last impulse leg, defined by the last significant trend base and extreme prices, providing objective numeric data to assess whether retracements are shallow, typical, or unusually deep. The indicator supports various markets including Forex, indices, commodities, cryptocurrencies, and stocks. It offers configurable parameters such as EMA period, minimum pullback size, breakout buffer, and display options for labels and legend.
Customer reviews
5 | 50 % | |
4 | 50 % | |
3 | 0 % | |
2 | 0 % | |
1 | 0 % |


!["[Hamster-Coder] Bollinger Bands" logo](https://cdn.ctrader.com/image/webp/21d8e5d6-fb11-4bac-b9ee-cd05c2b76804_30327)


