
Description
OVERVIEW
This indicator implements Alfred François Tagher's "Trend Identification By Price And Time Filtering" methodology, published in the February 2024 issue of Technical Analysis of Stocks & Commodities magazine.
The concept combines price action with time-based filtering to reduce market noise and identify sustained trends. Rather than reacting to every price movement, the indicator only changes trend direction when price closes beyond the prior period's range—a condition that signals genuine momentum rather than random fluctuation.
CORE RULES
The original rules are simple:
- If the period's close exceeds the previous period's high → trend is UP
- If the period's close is below the previous period's low → trend is DOWN
- The trend remains unchanged until a reversal condition occurs
This approach filters out minor price movements that stay within the prior period's range, focusing only on breakouts that demonstrate commitment.
HOW IT WORKS
The indicator compares the current timeframe's close against the selected higher timeframe's previous period high and low:
- Trend Up: Current close > Prior period high
- Trend Down: Current close < Prior period low
- No Change: Close remains within prior period's range
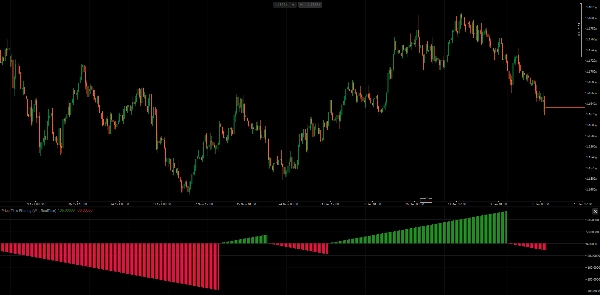
The histogram displays a running count of bars in the current trend direction—positive values for uptrends, negative values for downtrends. This visualizes both trend direction and duration.
FILTERING MODES
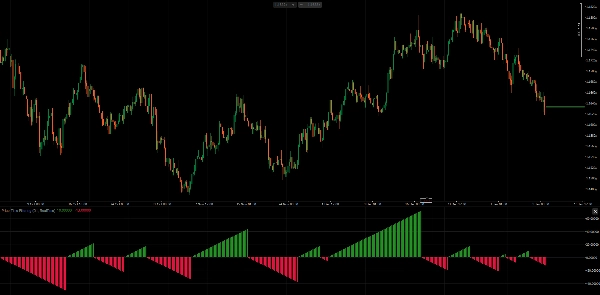
1. PeriodEnd Mode Evaluates trend only when a higher timeframe period completes. This matches the original methodology where weekly trend is determined by Friday's close (or month-end close for monthly). More stable, fewer signals.
2. RealTime Mode Evaluates trend on every bar using the current close against the prior period's range. Provides earlier signals but may produce more noise during the period.
PARAMETERS
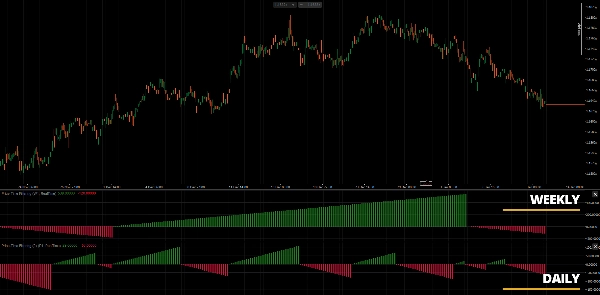
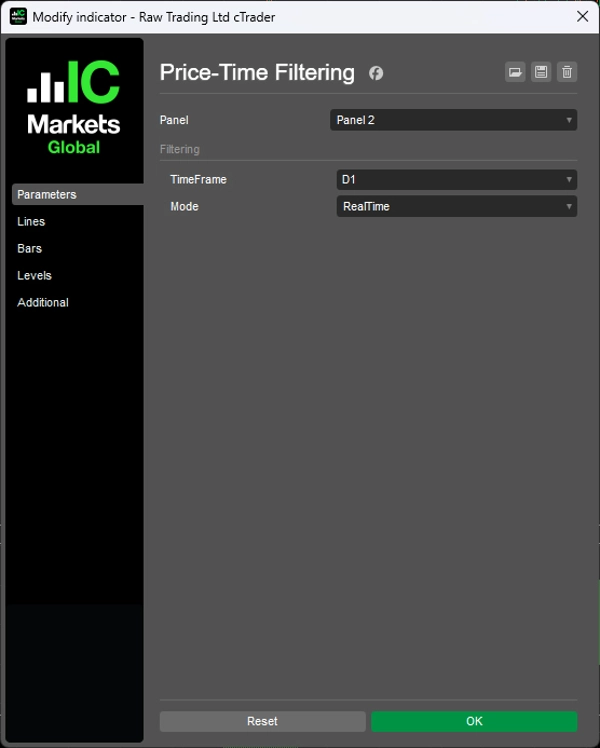
- TimeFrame: Higher timeframe for trend evaluation (e.g., Weekly, Monthly)
- Mode: PeriodEnd (original methodology) or RealTime (responsive variant)
INTERPRETATION
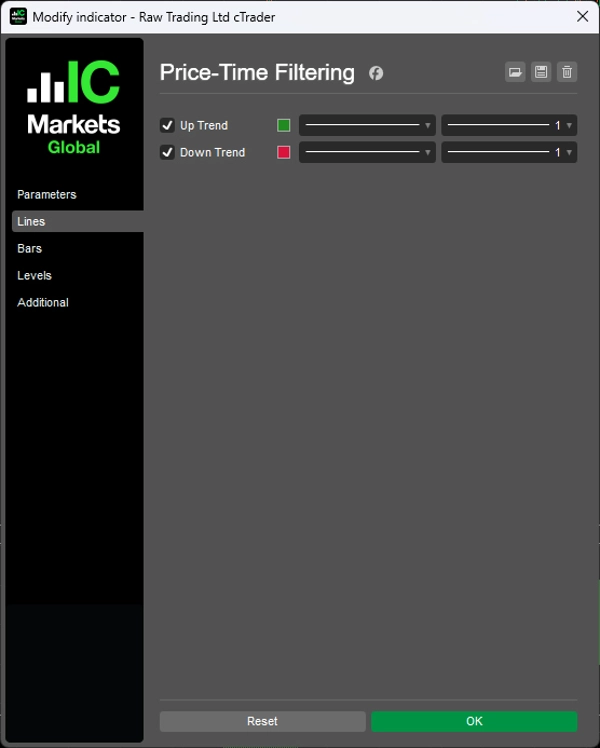
- Green histogram: Uptrend in progress, bar count shows duration
- Red histogram: Downtrend in progress, bar count shows duration
- Histogram reset: Trend reversal occurred
The indicator works best on daily charts with Weekly or Monthly timeframe selection, as described in the original article. However, the implementation supports any timeframe combination.
NOTES
- Originally designed for daily charts with weekly/monthly evaluation
- Works on any timeframe combination where the selected timeframe is higher than the chart timeframe
- The bar count provides a measure of trend maturity—longer counts suggest established trends
- Consider combining with price structure analysis for entry timing
REFERENCE
Tagher, Alfred François. "Trend Identification By Price And Time Filtering." Technical Analysis of Stocks & Commodities, February 2024.
__________________________________________________________________________________________
MORE FREE INDICATORS
Explore a wide range of market analysis tools—from structure and volume to regression, volatility, and custom timeframes.
Source code is available on GitHub repository.
All free to use. But if you feel like sending coffee support, you can route it here.
Support/Resistance
Volume
- Volume Activity Profiler
- Volume Efficiency Analyzer
- Volume Profile Analytics
- Volume Profile - Updated
- Volume Spread Analysis
- VWAP (Volume Weighted Average Price)
Moving Averages
- SSL Channel
- Anchored Moving Average
- Deviation-Scaled Moving Average
- Gann High Low Activator
- Instantaneous Trendline
- Kaufman Adaptive MA with Trend Vision
- Moving Average Channel
- Moving Averages Suite
- Trend Channel Moving Average
Utilities/Custom
Regression-Based
Volatility
Oscillators
__________________________________________________________________________________________
DISCLAIMER
Trading involves risk. This indicator is intended for technical analysis only — always apply proper risk management and trade responsibly.
FEECBACK & IMPROVEMENTS
If you have suggestions, feature requests, or ideas for enhancement, please leave a comment in the Discussion tab. Your feedback helps improve the indicator for everyone.
Summary
The indicator supports two filtering modes: PeriodEnd mode, which evaluates trends only at the close of a higher timeframe period (e.g., weekly or monthly), providing more stable signals; and RealTime mode, which updates trend status on every bar for more responsive but potentially noisier signals. Users can select the higher timeframe for trend evaluation, typically weekly or monthly, while applying the indicator on lower timeframe charts.
A histogram visually represents trend direction and duration, with positive values and green bars indicating uptrends, negative values and red bars indicating downtrends, and resets marking trend reversals. The indicator is applicable across various markets including Forex, indices, commodities, crypto, and stocks, and supports any timeframe combination where the selected higher timeframe exceeds the chart timeframe.


