Inside CandlePRO
Indicator
158 downloads
Version 1.0, Dec 2025
Windows, Mac
5.0
Reviews: 1
Description
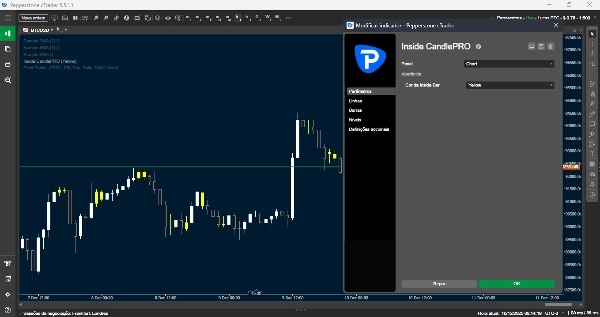
Inside Candle PRO - Professional Inside Bar Pattern Detector
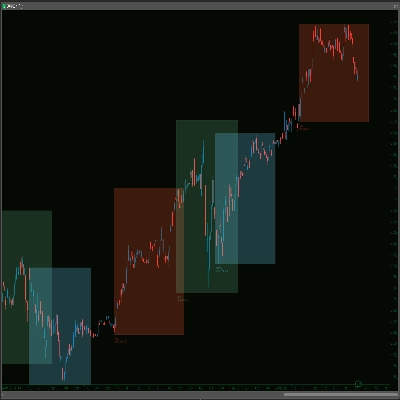
Automatically detect Inside Bar patterns with Inside Candle PRO, a technical indicator that identifies and highlights consolidation patterns on your chart.
What is an Inside Bar?
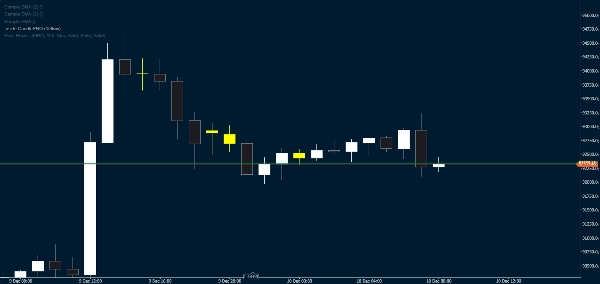
An Inside Bar occurs when a candle is completely contained within the range of the previous candle (lower high and higher low). This pattern indicates market consolidation and can precede significant price movements.
Key Features:
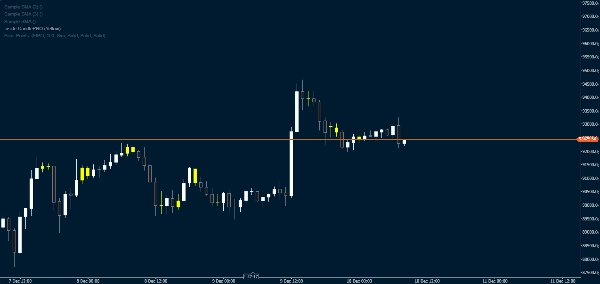
- Automatic real-time detection of Inside Bars
- Visual highlighting with customizable colors
- Optimized performance for smooth operation
- Works on all timeframes and instruments
- Simple and intuitive interface
Why Use Inside Candle PRO?
- Quickly identify consolidation zones
- Prepare for potential breakouts
- Enhance your visual technical analysis
- Save time identifying patterns
Customization:
Choose from 8 different colors to highlight Inside Bars, adapting the indicator to your chart style.
Compatibility:
Works on all instruments (Forex, Indices, Stocks, Cryptocurrencies) and any timeframe.
Summary
AI summary
Inside Candle PRO is a technical indicator designed to automatically detect Inside Bar patterns on trading charts. An Inside Bar occurs when a candle’s range is fully contained within the previous candle’s range, signaling market consolidation that may precede significant price movements. This indicator highlights these patterns in real time with customizable colors, supporting up to eight color options to fit various chart styles.
The tool operates smoothly across all timeframes and instruments, including Forex, indices, stocks, cryptocurrencies, and commodities. Its interface is simple and intuitive, enabling traders to quickly identify consolidation zones and prepare for potential breakouts. Inside Candle PRO enhances visual technical analysis by saving time in pattern recognition and improving chart readability.
Key features include automatic real-time detection, visual highlighting, optimized performance, broad market compatibility, and customization options. It supports major symbols such as BTCUSD, EURUSD, GBPUSD, NZDUSD, USDJPY, XAUUSD, and NAS100, among others. This indicator is suitable for traders seeking to incorporate Inside Bar pattern analysis into their trading strategies across diverse markets and timeframes.
Indicator profile
Customer reviews
5.0
Reviews: 1
5 | 100 % | |
4 | 0 % | |
3 | 0 % | |
2 | 0 % | |
1 | 0 % |
Customer reviews
December 10, 2025
Inside CandlePRO highlights clean Inside Bar structures and their breakout zones. Great for intraday momentum and consolidation setups. Lightweight, accurate and easy to read. Can get busy on lower TFs, but filtering helps. Alerts and volatility filters would make it even better.
Discussion
FAQ
BTCUSD
Forex
Indices
EURUSD
Commodities
GBPUSD
NZDUSD
Prop
Crypto
Stocks
XAUUSD
NAS100
USDJPY
Products available through cTrader Store, including trading bots, indicators and plugins, are provided by third-party developers and made available for informational and technical access purposes only. cTrader Store is not a broker and does not provide investment advice, personal recommendations or any guarantee of future performance.


Price
Since 26/10/2025
6
Sales
511
Free installs