"HeatmapLiquidityZones" logo
Indicator
1 purchases
Version 1.0, May 2026
Windows, Mac
5.0
Reviews: 2
"HeatmapLiquidityZones" uploaded image
20
Sales
234
Free installs

Heatmap Liquidity Zones

Visualize volume-at-price, uncover hidden support/resistance, and track market liquidity in real-time.


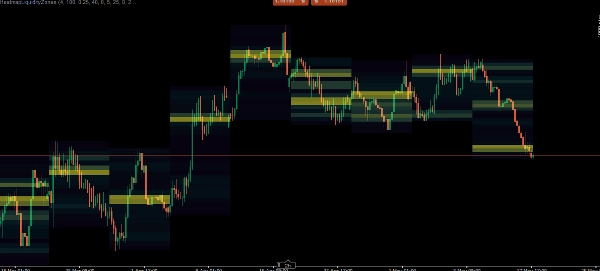
The Heatmap Liquidity Zones indicator is a powerful volume-profiling tool that translates raw market data into an intuitive visual heatmap. By analyzing tick volume across specific higher timeframes (HTF), it identifies exactly where the most significant buying and selling pressure is concentrated.


Instead of guessing where the market might reverse, this indicator plots precise, volume-backed liquidity levels. These levels extend forward dynamically and automatically disappear once the price breaks and invalidates them, keeping your chart clean and strictly relevant to current price action.


Key Features

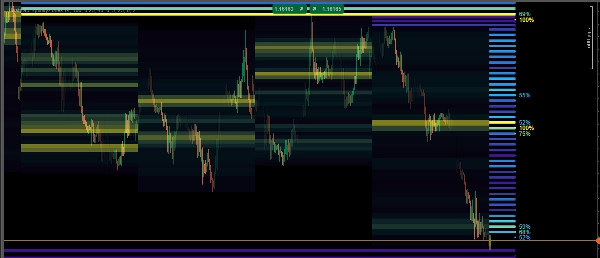
Multi-Timeframe Heatmap: Select your preferred macro timeframe (1H, 4H, Daily, Weekly, or Monthly). The indicator will map the volume distribution for that specific period directly onto your lower timeframe charts.


Dynamic ATR Binning: The price scale is sliced into dynamic "bins" (zones) calculated using the Average True Range (ATR). This ensures the heatmap adapts intelligently to both highly volatile and tightly consolidating markets.


Auto-Invalidating Liquidity Levels: When a specific price bin accumulates a massive amount of volume, it becomes a "Liquidity Level." The indicator draws a solid line extending into the future. If the price successfully breaks through this level, the line is automatically removed (invalidated).


Density Gradient Coloring: Visually distinguish between Low, Mid, and High volume nodes. The heatmap uses a color gradient to show you exactly where the heaviest volume is trapped.


Percentage Tracking: High-density liquidity levels display a percentage label (e.g., 85%), showing exactly how strong that node is relative to the rest of the HTF period's volume.

Indicator profile
5.0
Reviews: 2
5
100 %
4
0 %
3
0 %
2
0 %
1
0 %
Customer reviews
May 22, 2026
Heatmap Liquidity Zones is a strong liquidity visualization tool that highlights volume concentration areas and dynamically tracks important market zones. The adaptive ATR-based heatmap works well across different volatility conditions, while auto-invalidating levels help keep the chart clean. A useful indicator for traders focused on liquidity, market structure, and context-based decision making.
May 22, 2026
Key Levels
Volume
ATR
Support & Resistance
Products available through cTrader Store, including trading bots, indicators and plugins, are provided by third-party developers and made available for informational and technical access purposes only. cTrader Store is not a broker and does not provide investment advice, personal recommendations or any guarantee of future performance.

More from this author

Indicator
Volume
Key Levels
+1
Whale Liquidity & Absorption Profile Track institutional money, analyze order flow, and spot reversal zones with volumet
Indicator
AI
Prop
+9
Phoenix Zones - Detector de Reversiones Críticas
Indicator
AI
Prop
+14
Professional Trading Indicator Transform Your Trading with Intelligent Signal Detection RenkoProfit
Indicator
ReversalGuard Pro: Domina el Mercado con Zonas de Soporte y Resistencia de Alta Precisión"
Indicator
AI-assisted
Predictive Monte Carlo Engine Forecast future price paths using institutional-grade statistical models and probability
Indicator
BOS
CHOCH
+5
Smart Money Concepts Automate your institutional analysis and make decisions with pinpoint precision..
Indicator
Liquidity Grab
Liquidity Sweep
+1
CRT Sweep Tracker is an advanced panel for Candle Range Theory (CRT) traders to track HTF sweeps and manage live trades.
Indicator
SMC
Forex
+13
MultiFrameCandles para cTrader: La Herramienta Definitiva para Dominar Cualquier Marco de Tiempo
Indicator
Prop
Forex
+10
Heatmap Pro analiza la volatilidad, el volumen y la acción del precio para "pintar" tu gráfico con zonas de color.
Indicator
Forex
BTCUSD
+11
Catch High-Probability Reversals with Precision Swing
Indicator
BOS
VWAP
+4
Gold premiun XAUUSD Exclusive Real-Time Adaptive Intelligence
Indicator
MSS
Market Structure
NY HTF Candles is a precision panel designed specifically for institutional traders

You may also like

Indicator
BOS
CHOCH
+5
Smart Money Concepts Automate your institutional analysis and make decisions with pinpoint precision..
Indicator
uses HTF 1hr,4hr, 1D to check for valid directions enjoy
Indicator
Market Sessions
Indicator
SMC
Forex
+7
Simple Smart Money Concepts (SMC)
Indicator
Prop
Forex
+1
⚔️ JPY Samurai Breakout Lite — Simple Breakout Indicator for cTrader ⚔️
Indicator
Inducement
Key Levels
+5
Digital Clock Overlay that displays a live, second-by-second clock and optional date directly on the trading chart.
Indicator
MSS
Market Structure
NY HTF Candles is a precision panel designed specifically for institutional traders
Indicator
Forex
Crypto
+3
This is a tool to help traders open orders/close orders/modify orders quickly with just one click
Indicator
ADX
ATR
+5
Identify high-probability weeks before they happen. Quarterly cycles + weekly bias across 8 instruments, live.
Indicator
RSI
Signal
The Wyckoff Toolkit is the ultimate ally for traders seeking to decode the market through the lens of "smart money."
Indicator
Flag
Key Levels
+5
Zig Zag filters out minor price noise and connects only the most significant swing and lows for key turning points.
Indicator
Forex
Crypto
+2
Market Structure Indicator – Your Trading Map in a Noisy Market. No more Panicking Which one, Where, Why and How.
Indicator
Prop
Forex
+13
Decision System Indicator According to Cosmic Laws
Indicator
RSI
Breakout
+1
"Identify key market zones and visualize support/resistance from multiple timeframes on a single chart.
Indicator
Track VWAP for Asia, London, NY, Sydney, Daily, Weekly, Monthly & Custom Sessions. Perfect for FX & intraday trading!
Indicator
ATR
MACD
+15
BrickAlgo TrendPulse is an advanced technical analysis tool that combines multiple indicators with filterin mechanisms.
Indicator
SMC
Grid
+19
Smart fractals + auto Fibonacci + dynamic S/R zones with HTF confluence & Bull/Bear bias panel. Institutional-grade.
Indicator
Indices
MFI- MTF is a multi-timeframe momentum indicator that brings higher timeframe perspective to your current chart
20
Sales
234
Free installs