
Description
Showcase:
Market Cipher B is a powerful yet user-friendly technical analysis indicator designed to help you make confident trading decisions across financial markets – from cryptocurrencies to stocks and forex. Whether you're a beginner or a seasoned trader, this oscillator delivers clear buy and sell signals, giving you the edge you need to navigate volatile markets with ease.
Why Choose Market Cipher B?
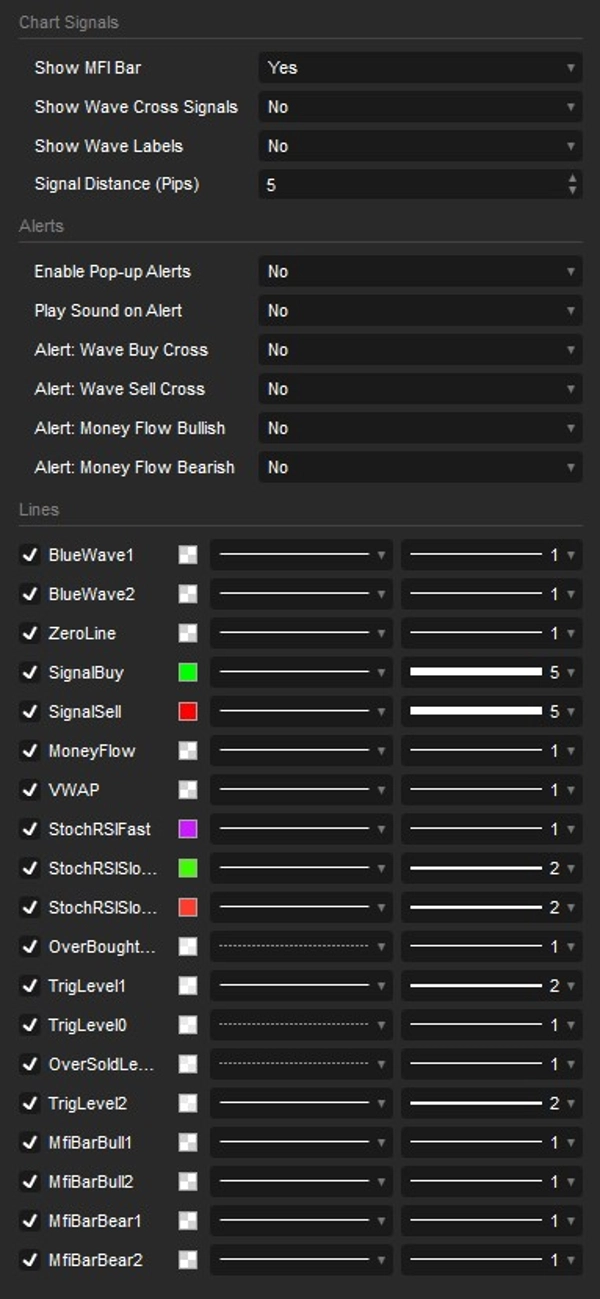
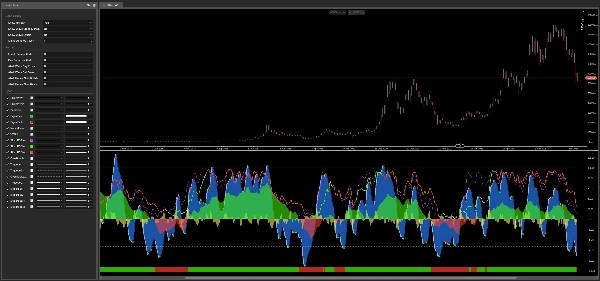
1. Clear Buy and Sell Signals The indicator pinpoints optimal entry and exit points with easy-to-read signals. Green dots signal buying opportunities, while red dots indicate when to sell. This makes it simple for anyone to act quickly and decisively, even without deep technical knowledge.
2. Blue Waves – Market Momentum at a Glance Market Cipher B uses two dynamic blue wave lines that reveal whether the market is gaining strength or losing steam. Their crossovers highlight key moments to catch emerging trends or avoid potential losses. The wave system forms the core engine of the indicator, providing a reliable foundation for all other signals.
3. Wave Momentum Spread – Your Directional Compass The yellow line represents the spread between the two blue waves, acting as a real-time momentum gauge. When it rises above zero, buyers are in control; when it falls below, sellers dominate. This helps you instantly determine whether a trend has strength behind it or is nearing exhaustion and potential reversal.
4. Money Flow – Track Where the Money Goes The green-and-red Money Flow line uncovers where investors are directing their capital. Calculated as a smoothed oscillator over 60 periods, it reveals when institutional or large-scale players are entering or exiting the market. Crossovers above and below the zero line are particularly significant, often preceding major price movements and giving you a meaningful head start.
5. MFI Bar – Instant Capital Flow Signal A color-coded bar displayed at the bottom of the indicator panel provides an at-a-glance visualization of the current Money Flow direction. A green bar signals bullish capital dominance, while a red bar indicates bearish pressure. Color transitions on the bar highlight potential trend reversals immediately, without requiring any numerical analysis – making it one of the fastest visual cues available in the indicator.
6. Stochastic RSI – Precision Timing A purple Stochastic RSI line, paired with green-and-red slower RSI lines, helps you identify overbought (potentially overpriced) or oversold (potentially undervalued) market conditions with high precision. The dual-speed design – a fast line (40-period) and a slow line (81-period) – allows you to distinguish between short-term noise and genuine momentum shifts, making it ideal for finding high-probability reversal points and avoiding common market traps.
7. Smart Alert System – Never Miss a Signal Market Cipher B includes a fully configurable notification system that keeps you informed even when you're away from the screen. You can independently enable or disable pop-up alerts and sound notifications for four key events: Wave Buy Cross, Wave Sell Cross, Money Flow crossing above zero (Bullish), and Money Flow crossing below zero (Bearish). Each alert type can be toggled separately, giving you complete control over what matters most to your trading strategy.
8. Flexibility and Customization Market Cipher B works seamlessly on any market and timeframe available in cTrader – from one-minute scalping charts to weekly swing trading views. You have full control over which components are displayed, including the MFI Bar, wave cross signals, signal labels (Buy/Sell text directly on the price chart), and all alert types. This modularity means you can tailor the indicator to match your exact trading style without visual clutter.
Who Is Market Cipher B For?
New Traders will appreciate the intuitive buy/sell signals, color-coded visuals, and clear reference levels that make it easy to start trading without requiring years of technical analysis experience. The indicator communicates its conclusions visually, so you spend less time reading numbers and more time acting on opportunities.
Experienced Investors will find value in the advanced components – Money Flow, the Wave Momentum Spread, and the dual Stochastic RSI – which together provide a multi-layered view of market structure suitable for sophisticated, high-conviction strategies.
Day and Swing Traders benefit from the indicator's timeframe flexibility and fast signal generation, allowing them to capitalize on both rapid intraday moves and longer-term directional trends without switching between multiple tools.
Summary
Additional components include a Money Flow line that tracks capital movement by large investors, accompanied by a color-coded Money Flow bar for quick visual cues on market pressure. A dual-speed Stochastic RSI helps identify overbought and oversold conditions, aiding in precise timing for potential reversals.
Market Cipher B supports full customization, allowing users to enable or disable specific features and alerts for key events such as wave crosses and Money Flow shifts. It operates on any timeframe, from minute charts to weekly views, making it suitable for new traders, experienced investors, day traders, and swing traders. The indicator integrates multiple analytical tools into one interface, aiming to provide a comprehensive market overview and assist in making informed trading decisions.
Customer reviews
5 | 67 % | |
4 | 33 % | |
3 | 0 % | |
2 | 0 % | |
1 | 0 % |


!["[Stellar Strategies] Inside Bar with Signals" logo](https://cdn.ctrader.com/image/webp/1d9e8bfa-3b2c-4440-bb37-5856902008a7_30683)


