Description
EXTENDED VERSION AVAILABLE — HERE
You're currently viewing the original version. The extended version of this indicator has been released with additional features:
- Enhanced Age Display: Years, months, weeks, days format (e.g., "3y 2w 4d")
- Show All FVGs: Set "FVG to Display" to -1 to display unlimited historical FVGs
- Extend Filled FVGs: Option to extend filled FVG boxes to current bar
- Fibonacci Levels: Automatic levels (23.6%, 38.2%, 50%, 61.8%, 78.6%) on partial and filled FVGs
- Partial Fill Threshold: Customizable threshold (50-99%, default 90%)
__________________________________________________________________________________________
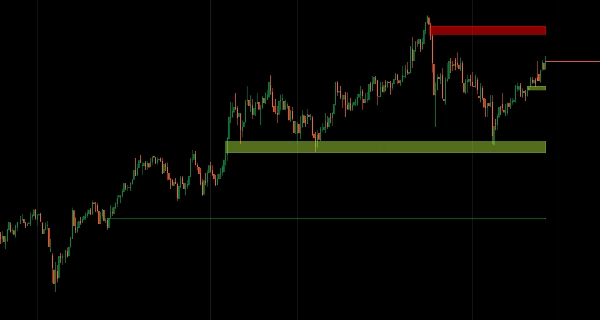
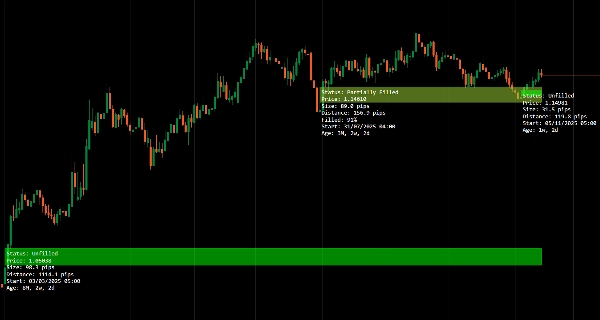
Identify Fair Value Gaps with age tracking and fill status monitoring.
Automatically detects bullish and bearish gaps, tracks their fill behavior (unfilled, partial, fully filled) in real-time, and displays gap age for prioritization.
Multi-timeframe scanning to align HTF structural gaps with LTF price action, dynamic status updates as price interacts with zones, and minimal non-intrusive labeling deliver focused liquidity imbalance analysis for traders targeting gap fills and structure-based entries.
FEATURES
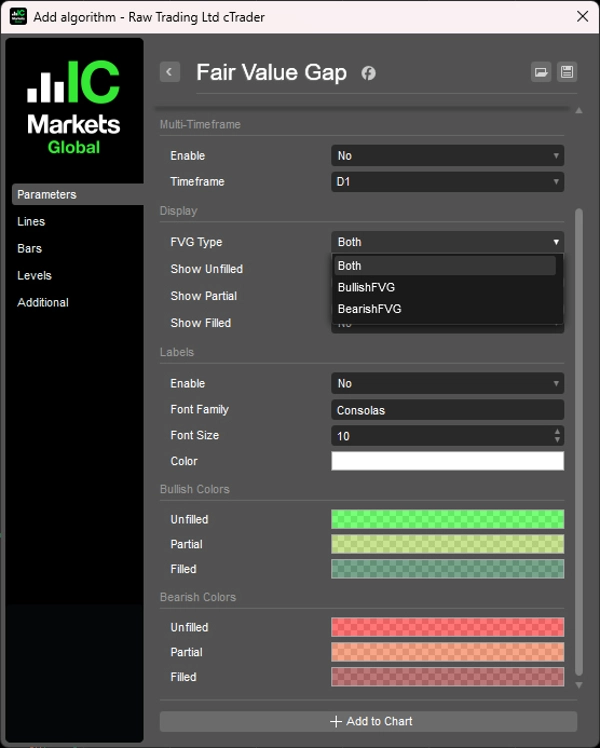
FVG Identification
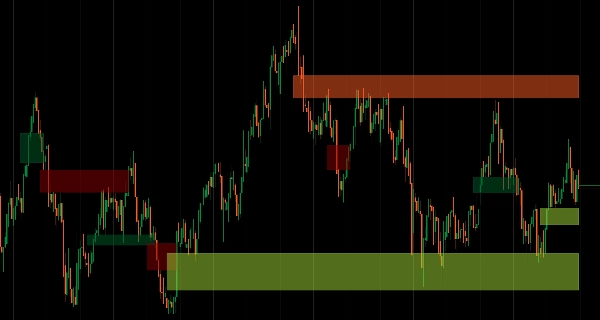
- Automatically detects bullish and bearish Fair Value Gaps
- Tracks unfilled, partially filled, and fully filled status in real-time
- Clean visual plotting with minimal chart clutter
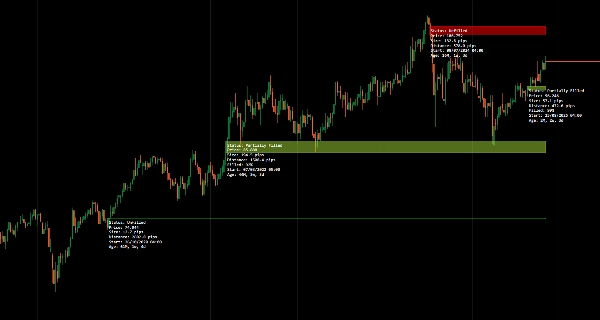
Age Labeling
- Displays how much time has passed since each gap formed
- Helps prioritize fresh vs. stale gaps for trade selection
- Time context improves decision-making on gap relevance
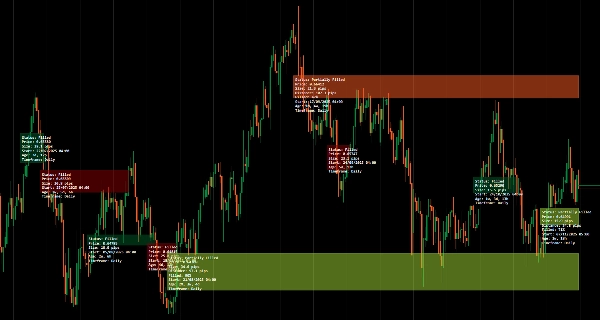
Status Tracking
- Shows current fill status: unfilled, partially filled, or fully filled
- Updates dynamically as price interacts with the gap
- Visual confirmation of liquidity capture
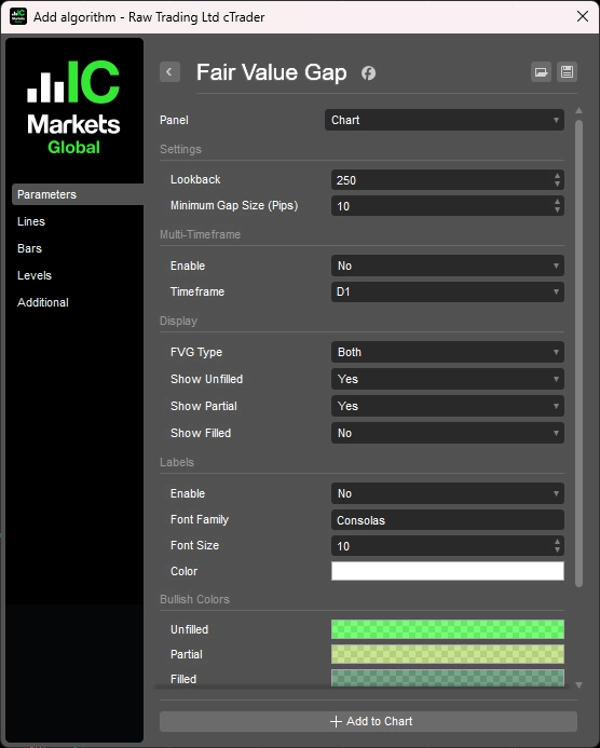
Multi-Timeframe Mode
- Scan and display higher timeframe FVGs on lower timeframe charts
- Align HTF structural gaps with LTF price action
- Improves multi-timeframe analysis workflow
Clean, Minimal UI
- Non-intrusive labels designed for clarity
- Informative without cluttering your price view
- Professional presentation for focused analysis
__________________________________________________________________________________________
MORE FREE INDICATORS
Explore a wide range of market analysis tools—from structure and volume to regression, volatility, and custom timeframes.
Source code is available on GitHub repository.
All free to use. But if you feel like sending coffee support, you can route it here.
Support/Resistance
Volume
- Volume Activity Profiler
- Volume Efficiency Analyzer
- Volume Profile Analytics
- Volume Profile - Updated
- Volume Spread Analysis
- VWAP (Volume Weighted Average Price)
Moving Averages
- Anchored Moving Average
- Deviation-Scaled Moving Average
- Instantaneous Trendline
- Kaufman Adaptive MA with Trend Vision
- Moving Average Channel
- Moving Averages Suite
- Trend Channel Moving Average
Utilities/Custom
Regression-Based
Volatility
Oscillators
__________________________________________________________________________________________
DISCLAIMER
Trading involves risk. This indicator is intended for technical analysis only — always apply proper risk management and trade responsibly.
FEECBACK & IMPROVEMENTS
If you have suggestions, feature requests, or ideas for enhancement, please leave a comment in the Discussion tab. Your feedback helps improve the indicator for everyone.
Summary
Customer reviews
5 | 100 % | |
4 | 0 % | |
3 | 0 % | |
2 | 0 % | |
1 | 0 % |