
Description
UPGRADED VERSION AVAILABLE HERE
Looking for more than just native timeframe overlays? The upgraded Custom Timeframes indicator extends this concept with powerful additions:
- Non-standard periods (5H, 7H, 9H-23H, 25m, 35m, 50m, 55m, 4-day, 2-weekly, 3-weekly, multi-monthly, multi-yearly)
- OHLC lines with bar offset control for completed or forming bars
- Seven Fibonacci levels (11.4% to 88.6%) with equilibrium zone highlighting
- Moving averages calculated directly on custom timeframe structure (9 MA types, 8 price sources)
- Toggle buttons for quick feature management.
If you need periods between standard chart intervals with full technical analysis overlay, check out the upgraded version.
__________________________________________________________________________________________
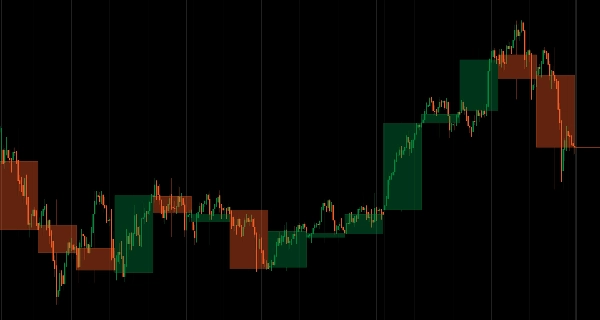
Overlay real-time HTF candles on any chart without switching timeframes.
Displays higher timeframe candle structure (body and wicks) directly on lower timeframe charts with live updates as the period progresses.
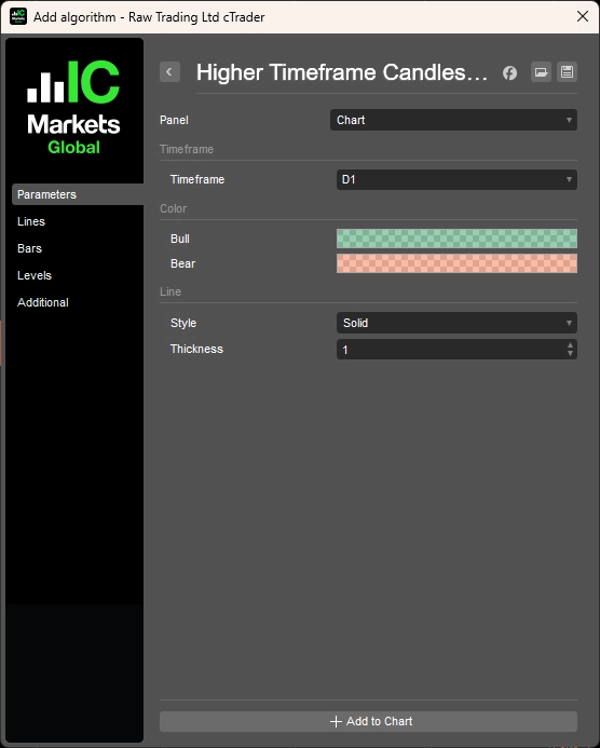
Flexible timeframe selection (Daily on H1, Weekly on H4, Monthly on Daily), color-coded bull/bear bias (green/red), customizable line style and transparency, and lightweight performance deliver continuous HTF context for traders monitoring structure across multiple timeframes without chart switching.
FEATURES
Flexible Timeframe Selection
- Any HTF: Daily on H1, Weekly on H4, Monthly on Daily—your choice
- Real-time updates: HTF candle redraws as the period progresses
- Always in view: Trade lower timeframes while maintaining higher timeframe context
Visual Clarity
- Color-coded: Bull (green), Bear (red)—instant bias confirmation
- Customizable: Line style, thickness, transparency
- Clean presentation: Body and wicks clearly displayed
Simple Integration
- No timeframe switching required
- Maintains chart context while showing HTF structure
- Lightweight and performance-optimized
__________________________________________________________________________________________
MORE FREE INDICATORS
Explore a wide range of market analysis tools—from structure and volume to regression, volatility, and custom timeframes.
Source code is available on GitHub repository.
All free to use. But if you feel like sending coffee support, you can route it here.
Support/Resistance
Volume
- Volume Activity Profiler
- Volume Efficiency Analyzer
- Volume Profile Analytics
- Volume Profile - Updated
- Volume Spread Analysis
- VWAP (Volume Weighted Average Price)
Moving Averages
- Anchored Moving Average
- Deviation-Scaled Moving Average
- Instantaneous Trendline
- Kaufman Adaptive MA with Trend Vision
- Moving Average Channel
- Moving Averages Suite
- Trend Channel Moving Average
Utilities/Custom
Regression-Based
Volatility
Oscillators
__________________________________________________________________________________________
DISCLAIMER
Trading involves risk. This indicator is intended for technical analysis only — always apply proper risk management and trade responsibly.
FEECBACK & IMPROVEMENTS
If you have suggestions, feature requests, or ideas for enhancement, please leave a comment in the Discussion tab. Your feedback helps improve the indicator for everyone.


!["[Hamster-Coder] Price" logo](https://cdn.ctrader.com/image/webp/893fb641-d5b3-44d8-91fb-6a2dc6f3d309_30647)


