คำอธิบาย
คำนวณระดับแนวรับและแนวต้านโดยใช้วิธี Pivot มืออาชีพห้ารูปแบบในทุกกรอบเวลา
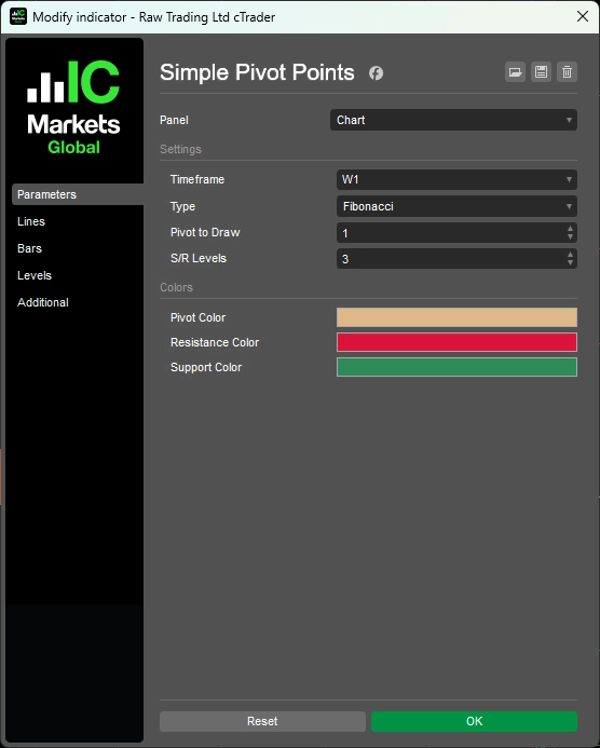
สร้างระดับ Pivot อัตโนมัติ (มาตรฐาน, ฟีโบนัชชี, วูดดี้, คามาริลลา, เดอมาร์ก) จากข้อมูล M5 ถึงรายเดือน พร้อมการแสดงผลตามช่วงเวลาของแต่ละช่วง
อัลกอริทึมการคำนวณห้ารูปแบบที่มีตรรกะการเว้นระยะ S/R ที่แตกต่างกัน ระดับแนวรับ/แนวต้านที่ปรับแต่งได้ (0-6 ต่อด้าน) การแสดง Pivot ในอดีตสำหรับหลายช่วงเวลาก่อนหน้า เส้นที่ติดป้ายอัตโนมัติ (PP, R1-R6, S1-S6) และการแสดงผลด้วยสีที่ช่วยให้การวิเคราะห์ Pivot ระดับสถาบันสำหรับเทรดเดอร์ที่มุ่งเป้าระดับราคาสำคัญและการกลับตัวในวันเดียวกัน
คุณสมบัติ
ห้าวิธีการคำนวณ
- มาตรฐาน: สูตรคลาสสิกของนักเทรดพื้นฐาน—Pivot ที่ได้รับความนิยมมากที่สุดทั่วโลก
- ฟีโบนัชชี: ใช้อัตราส่วน Fib (38.2%, 61.8%, 100%, 138.2%, 161.8%) สำหรับการเว้นระยะ S/R
- วูดดี้: ให้ความสำคัญกับราคาปิดมากกว่า—ตอบสนองต่อการเคลื่อนไหวราคาล่าสุดได้ดีขึ้น
- คามาริลลา: ระดับภายในวันที่แคบโดยใช้ตัวคูณ 1.1/12—นิยมสำหรับการสแคปปิ้ง
- เดอมาร์ก: สูตรตามเงื่อนไขที่อิงความสัมพันธ์ระหว่างราคาปิดกับราคาเปิด—มีเพียง 1 ระดับ S/R แต่ได้รับความเคารพสูง
ปรับแต่งได้เต็มที่
- ทุกกรอบเวลา: คำนวณจากข้อมูล M5, H1, H4, รายวัน, รายสัปดาห์, รายเดือน
- Pivot ในอดีต: แสดงได้หลายช่วงเวลาก่อนหน้า (เช่น Pivot 3 สัปดาห์ล่าสุด)
- ระดับที่ปรับแต่งได้: แสดงระดับแนวรับ/แนวต้าน 0-6 ต่อด้าน
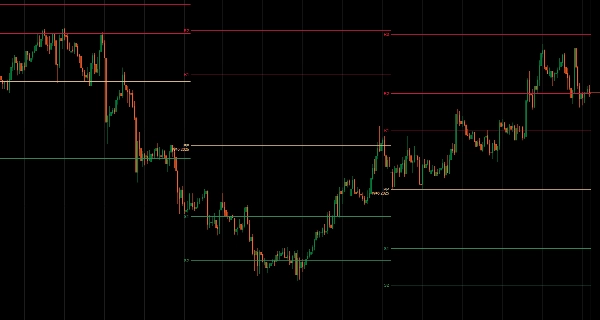
- เส้นติดป้ายอัตโนมัติ: PP, R1-R6, S1-S6 ชัดเจน
- เส้นตามช่วงเวลา: Pivot ของแต่ละช่วงแสดงเฉพาะในช่วงเวลานั้นเท่านั้น
- สีที่แตกต่าง: Pivot (สีน้ำตาลอ่อน), แนวต้าน (สีแดง), แนวรับ (สีเขียว)
__________________________________________________________________________________________
ตัวชี้วัดฟรีเพิ่มเติม
สำรวจเครื่องมือวิเคราะห์ตลาดหลากหลายประเภท—ตั้งแต่โครงสร้างและปริมาณไปจนถึงการถดถอย ความผันผวน และกรอบเวลาที่กำหนดเอง
ซอร์สโค้ดมีให้บน GitHub repository.
ทั้งหมดใช้ฟรี แต่ถ้าคุณต้องการสนับสนุนด้วยกาแฟ คุณสามารถส่งได้ ที่นี่.
แนวรับ/แนวต้าน
ปริมาณ
- โปรไฟล์กิจกรรมปริมาณ
- ตัววิเคราะห์ประสิทธิภาพปริมาณ
- วิเคราะห์โปรไฟล์ปริมาณ
- โปรไฟล์ปริมาณ - อัปเดต
- การวิเคราะห์การกระจายปริมาณ
- VWAP (ราคาถ่วงน้ำหนักด้วยปริมาณ)
ค่าเฉลี่ยเคลื่อนที่
- ช่อง SSL
- ค่าเฉลี่ยเคลื่อนที่แบบยึดจุด
- ค่าเฉลี่ยเคลื่อนที่แบบสเกลเบี่ยงเบน
- ตัวกระตุ้น Gann สูงต่ำ
- เส้นแนวโน้มทันที
- Kaufman Adaptive MA พร้อม Trend Vision
- ช่องค่าเฉลี่ยเคลื่อนที่
- ชุดค่าเฉลี่ยเคลื่อนที่
- ค่าเฉลี่ยเคลื่อนที่ช่องแนวโน้ม
ยูทิลิตี้/กำหนดเอง
แบบถดถอย
ความผันผวน
ออสซิลเลเตอร์
__________________________________________________________________________________________
ข้อจำกัดความรับผิดชอบ
การเทรดมีความเสี่ยง ตัวชี้วัดนี้มีไว้สำหรับการวิเคราะห์ทางเทคนิคเท่านั้น — โปรดใช้การบริหารความเสี่ยงอย่างเหมาะสมและเทรดอย่างรับผิดชอบเสมอ
ข้อเสนอแนะ & การปรับปรุง
หากคุณมีข้อเสนอแนะ คำขอฟีเจอร์ หรือไอเดียสำหรับการปรับปรุง โปรดแสดงความคิดเห็นในแท็บ Discussion ข้อเสนอแนะของคุณช่วยพัฒนาตัวชี้วัดให้ดียิ่งขึ้นสำหรับทุกคน
สรุป
รีวิวจากลูกค้า
5 | 100 % | |
4 | 0 % | |
3 | 0 % | |
2 | 0 % | |
1 | 0 % |