
Frac Support Resistance V1
Indicador
2 compras
Versão 1.0, Nov 2025
Windows, Mac
5.0
Avaliações: 1
Descrição
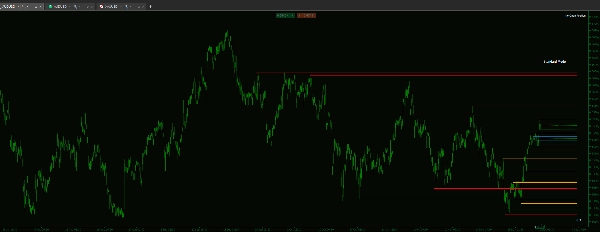
Se você negocia com base na estrutura de mercado, sabe que os níveis mais críticos geralmente são definidos em um timeframe superior. Este indicador personalizado resolve a frustração de identificar e acompanhar manualmente esses níveis.
Esta ferramenta foi projetada para fornecer uma hierarquia visual confiável, garantindo que você possa ver limites estruturais críticos e priorizar zonas de alto valor sem sair da sua tela de execução.
Principais Recursos e Controle Granular
- O indicador foi construído para desempenho excepcional e visualização limpa do gráfico:
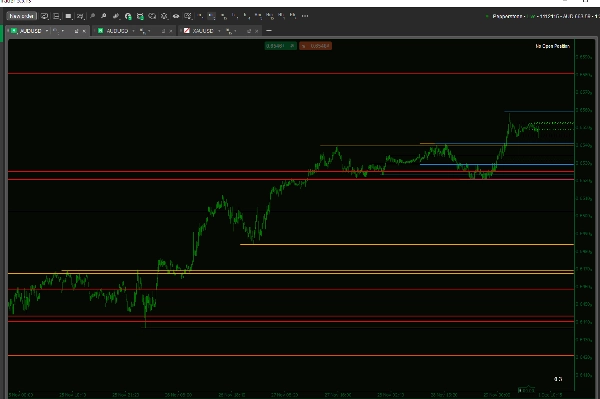
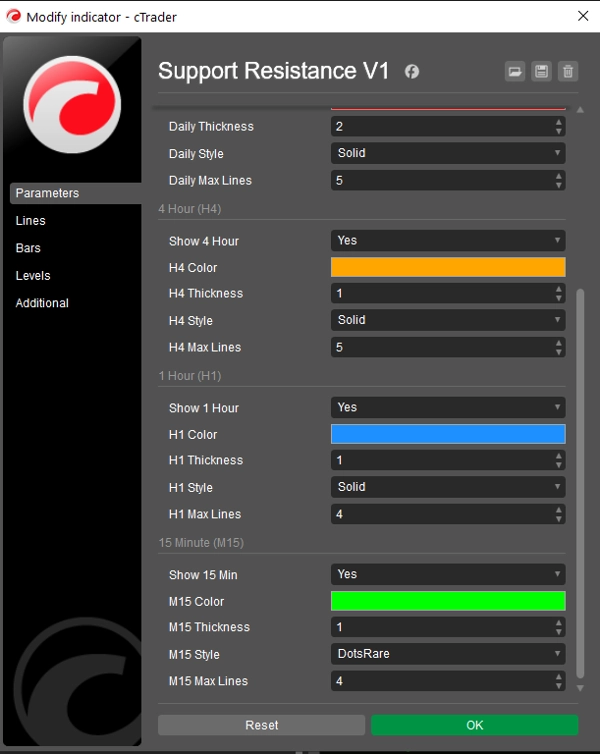
- Verdadeira Hierarquia Visual: Obtenha controle independente sobre a espessura, estilo da linha (Sólido, Tracejado, Pontilhado) e cor para cada timeframe individualmente.
- Benefício: Reconheça imediatamente a força de um nível apenas pela sua aparência (por exemplo, defina linhas D1 para serem Grossas/Sólidas para estrutura principal e linhas H1 para serem Finas/Pontilhadas para níveis imediatos).
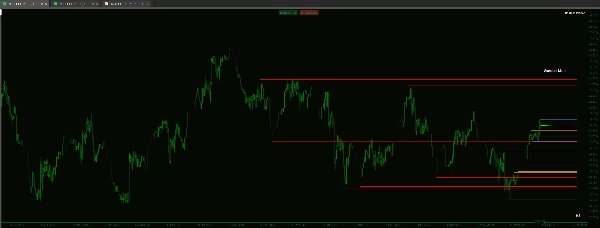
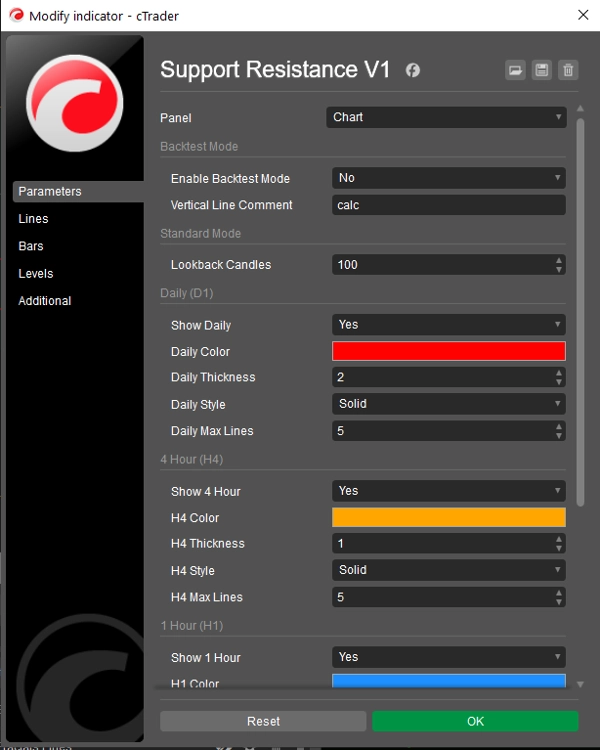
- Controle de Desempenho e Foco: Cansado de gráficos desordenados? Você pode limitar o Número Máximo de Linhas exibidas para cada timeframe individualmente.
- Exemplo: Defina Máximo de Linhas H4 para 5 e Máximo de Linhas D1 para 15 para priorizar níveis recentes em timeframes menores enquanto mantém uma visão mais profunda das estruturas principais.
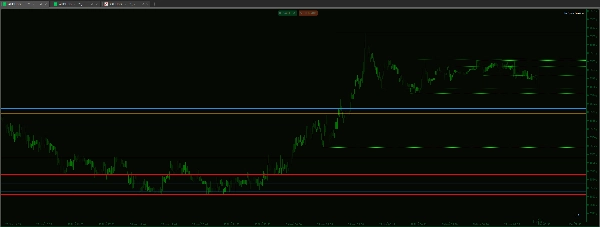
- Fundação de Código Limpo: Construído com lógica fractal confiável, garantindo que os níveis identificados sejam pivôs genuínos de alta/baixa usados na análise estrutural padrão.
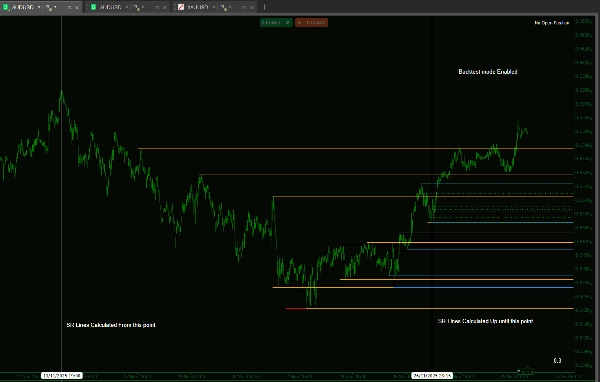
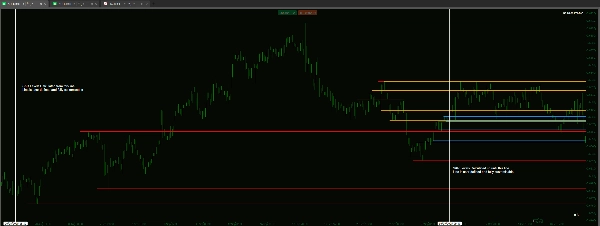
- Modo de Backtesting Dedicado: Inclui uma função para restringir a análise do indicador a um intervalo de tempo específico e definido no gráfico. Isso é essencial para backtesting manual preciso, simulando a progressão do tempo sem viés futuro.
Resumo
Resumo de IA
Frac Support Resistance V1 is a technical indicator designed to automatically calculate and display smart support and resistance lines derived from multiple timeframes: daily (D1), 4-hour (H4), hourly (H1), and 15-minute (M15). It assists traders who rely on market structure by visually highlighting critical price levels established on higher timeframes, reducing the need for manual identification.
Key features include customizable visual hierarchy, allowing independent adjustment of line thickness, style (solid, dashed, dotted), and color for each timeframe. This enables quick recognition of the relative strength of support and resistance levels. Users can also control chart clarity by setting maximum numbers of lines per timeframe to prioritize recent or major structural levels.
The indicator is based on fractal logic to identify genuine high and low pivots consistent with standard market structure analysis. It includes a dedicated backtesting mode that restricts analysis to a specified historical period, facilitating unbiased manual strategy testing by simulating real-time progression.
Frac Support Resistance V1 supports various markets including Forex, cryptocurrencies, commodities, indices, and stocks, with tags indicating compatibility with symbols like BTCUSD, EURUSD, GBPUSD, XAUUSD, NAS100, and USDJPY. The tool is suited for strategies involving breakout, scalping, smart money concepts, and grid trading.
Perfil do indicador
Avaliações de clientes
5.0
Avaliações: 1
5 | 100 % | |
4 | 0 % | |
3 | 0 % | |
2 | 0 % | |
1 | 0 % |
Avaliações de clientes
December 1, 2025
A small account test feels safer, and the plan becomes easier to stick with, and the chart still needs a final look.
Conversa
Perguntas frequentes
BTCUSD
Forex
Signal
Breakout
Indices
EURUSD
Commodities
GBPUSD
NZDUSD
Prop
Scalping
SMC
Crypto
Grid
Stocks
AI
XAUUSD
NAS100
USDJPY
Os produtos disponíveis através da cTrader Store, incluindo bots de negociação, indicadores e plugins, são fornecidos por programadores terceiros e são disponibilizados apenas para fins informativos e de acesso técnico. A cTrader Store não é um corretor e não fornece aconselhamento em matéria de investimento, recomendações pessoais ou qualquer garantia de desempenho no futuro.


Preço
Desde 14/01/2025
55
Vendas
11.5K
Instalações gratuitas