
Descrição
Pinescritlabs
Indicadores da Ctrader Store: 🤖cBots da Pinescritlabs Ctrader Store:
Fair Value Gap Sessions Gold & BTC Breakout Session Pivots(novo)
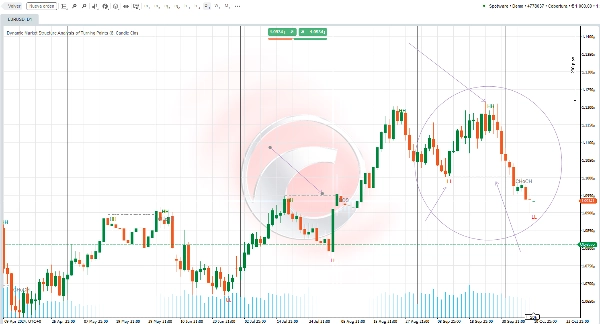
Dynamic Market Structure
Análise de Pontos de Virada
Fibonacci Linear
Regressão Multi-temporal
Multi-Level Candle Bias
Tracker
Auto Support and
Resistance Trend Lines
All Support and
Resistance Levels
Visão Geral das Configurações do Indicador 🌟
COMPRIMENTO DO SWING 📏
Este parâmetro determina quantos barras são consideradas à esquerda e à direita ao procurar pontos de swing. Um valor menor mostrará mais pontos, enquanto um valor maior reduzirá sua quantidade. Recomenda-se ajustar este parâmetro com base no seu estilo de negociação e ao alternar entre diferentes intervalos de tempo.
CHOCH 🔄
Ativar esta opção renomeará o primeiro rompimento contra a tendência como CHoCH (Change of Character), indicando assim uma possível mudança na direção do mercado.
HH e LL 📈📉
O indicador irá plotar os pontos altos de swing (HH) e os pontos baixos de swing (LL) no gráfico, permitindo que você visualize a estrutura do mercado de forma mais eficaz.
BOS ⚡
O indicador também exibirá os níveis de Break of Structure (BOS) ao detectar rompimentos nos pontos de swing, fornecendo insights adicionais sobre a dinâmica do mercado.
Resumo
Avaliações de clientes
5 | 33 % | |
4 | 67 % | |
3 | 0 % | |
2 | 0 % | |
1 | 0 % |


