
Descrição
https://chartshots.spotware.com/c/695be69b1a3ca
https://chartshots.spotware.com/c/695be2a98e848
https://chartshots.spotware.com/c/695be7e8e88fa
https://chartshots.spotware.com/c/695be31346fe7
https://chartshots.spotware.com/c/695be3bd18aea
https://chartshots.spotware.com/c/695be5d5687c7
Padrões Automáticos de Gráfico
📊 O QUE É?
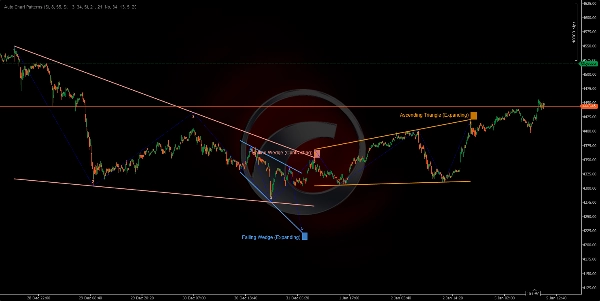
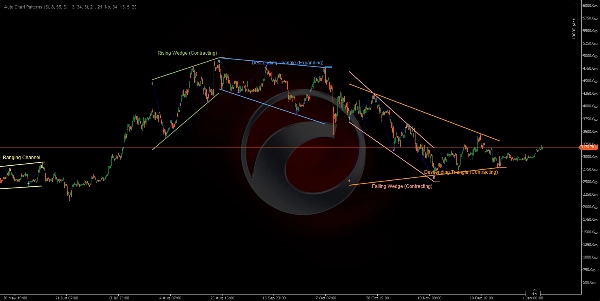
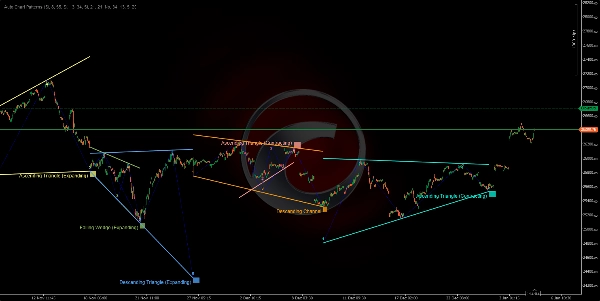
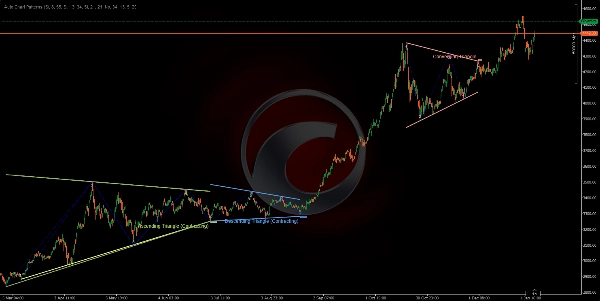
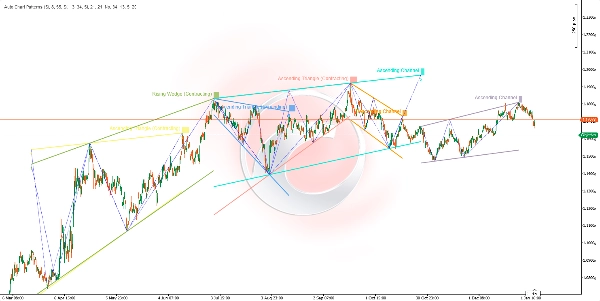
O indicador Auto Chart Patterns é um scanner avançado de formações geométricas que detecta e visualiza automaticamente padrões clássicos de gráfico usando análise de pontos de oscilação em múltiplos períodos de tempo. Ele identifica 14 diferentes formações geométricas incluindo canais, cunhas e triângulos, conectando máximas e mínimas de oscilação com linhas de tendência, criando um sistema abrangente de reconhecimento de padrões.
🎯 PARA QUE SERVE?
Este indicador ajuda os traders a:
- Detectar automaticamente 14 padrões clássicos de gráfico (canais, cunhas, triângulos) 📐
- Identificar zonas potenciais de rompimento antes que ocorram ⚡
- Visualizar estrutura de mercado através de relações geométricas de preço 🔍
- Negociar padrões de continuação e reversão com confirmação visual ✅
- Filtrar padrões por direção da tendência e tipo de pivô final 🎛️
- Analisar múltiplos períodos de oscilação simultaneamente para confluência 🌊
🔍 COMO FUNCIONA?
Sistema de Detecção de Pontos de Oscilação 📍
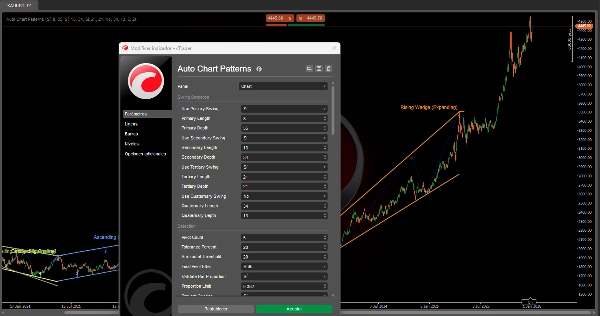
O indicador usa até quatro detectores independentes de oscilação funcionando simultaneamente, cada um com sensibilidade configurável:
- Lógica de Detecção:
-
- Monitora máximas e mínimas de preço em uma janela móvel (Período).
- Identifica picos locais (máximas de oscilação) e vales (mínimas de oscilação).
- Confirma oscilações somente após atender a um requisito mínimo de profundidade (previne ruído).
- Máxima de Oscilação: O preço faz a máxima mais alta no Período, depois cai por
MinDepthbarras. - Mínima de Oscilação: O preço faz a mínima mais baixa no Período, depois sobe por
MinDepthbarras.
- Quatro Camadas de Oscilação:
-
- Oscilação Primária (Padrão: Comprimento 8, Profundidade 55) - Estrutura de longo prazo 🔵
- Oscilação Secundária (Padrão: Comprimento 13, Profundidade 34) - Estrutura de médio prazo 🟢
- Oscilação Terciária (Padrão: Comprimento 21, Profundidade 21) - Estrutura de curto prazo 🟡
- Oscilação Quaternária (Padrão: Desativado) - Período personalizado 🟣
Cada detector pode ser ativado/desativado independentemente para focar em estruturas específicas do mercado.
Processo de Formação de Padrões 🎨
PASSO 1 - COLETA DE PIVÔS:
- O sistema coleta os 5 ou 6 pontos de oscilação mais recentes de qualquer detector ativo.
- Os pontos devem alternar entre máximas e mínimas (estrutura zigzag).
- Exemplo de 5 pontos: Máxima → Mínima → Máxima → Mínima → Máxima.
PASSO 2 - CONSTRUÇÃO DE LINHAS DE TENDÊNCIA:
- Separa pivôs em pontos superiores (máximas de oscilação) e pontos inferiores (mínimas de oscilação).
- Desenha duas linhas de tendência: limite superior e limite inferior.
- Para limites de 3 pontos: Testa 3 combinações (0-2, 0-1, 1-2) e seleciona o melhor ajuste ⭐
- Valida que as linhas de tendência não penetram os corpos das velas (apenas pavios permitidos).
- Calcula uma pontuação de ajuste: as linhas devem tocar menos de 20% das barras entre os pivôs.
PASSO 3 - ANÁLISE GEOMÉTRICA:
- Mede a relação angular entre os limites superior e inferior.
- Determina se a formação é Expansiva (alargando), Contrativa (estreitando), ou Paralela (largura constante).
- Identifica a direção da tendência: Ascendente, Descendente ou Neutra (horizontal).
- Classifica em um dos 14 tipos de formação baseado na geometria.
PASSO 4 - VALIDAÇÃO E FILTRAGEM:
- Verificação de Proporção de Barras: Garante que o espaçamento das oscilações seja proporcional (previne padrões distorcidos) ✅
- Prevenção de Sobreposição: Bloqueia novos padrões que conflitem com os existentes 🚫
- Verificação de Duplicatas: Impede redesenhar o mesmo padrão.
- Filtro de Pivô Final: Mostra apenas padrões que terminam com uma direção de pivô especificada (Para Cima/Para Baixo/Ambos).
- Filtro de Tipo de Formação: Ativa/desativa categorias específicas de padrões.
PASSO 5 - VISUALIZAÇÃO:
- Desenha linhas de limite superior e inferior em cores vibrantes de uma paleta de 12 cores 🎨
- Opcionalmente exibe linhas de oscilação zigzag conectando pivôs (azul pontilhado).
- Mostra números dos pivôs (1, 2, 3, 4, 5) em cada ponto de oscilação.
- Rotula a formação com o nome do padrão no pivô final.
- Codifica a cor do fundo atrás do rótulo para clareza.
📐 AS 14 FORMAÇÕES DETECTADAS
CANAIS (Formações Paralelas) 📦
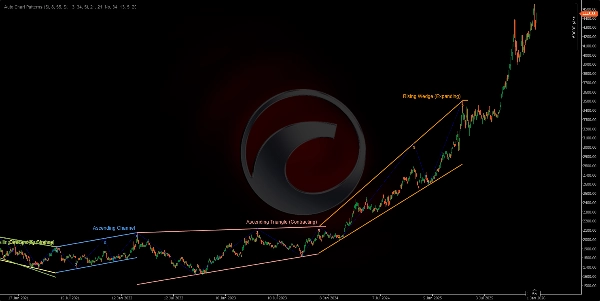
- Canal Ascendente (Paralelo Ascendente) 📈
-
- Ambos os limites inclinam-se para cima em ângulo semelhante.
- Indica uma tendência de continuação de alta.
- Negociação: Comprar no limite inferior, vender no limite superior.
- Canal Descendente (Paralelo Descendente) 📉
-
- Ambos os limites inclinam-se para baixo em ângulo semelhante.
- Indica uma tendência de continuação de baixa.
- Negociação: Vender no limite superior, comprar no limite inferior.
- Canal Lateral (Lateral/Horizontal) ↔️
-
- Ambos os limites são quase horizontais.
- Indica consolidação ou indecisão.
- Negociação: Estratégia de faixa, comprar no suporte/vender na resistência.
CUNHAS EXPANSIVAS (Formações Alargando) 📣
4. Cunha Ascendente (Expansiva) ⚠️
* Ambos os limites inclinam-se para cima, com um espaço alargando.
* Padrão de reversão de baixa - preço perdendo momentum ascendente.
* Negociação: Aguarde o rompimento do limite inferior, entre vendido.
5. Cunha Descendente (Expansiva) ⚠️
* Ambos os limites inclinam-se para baixo, com um espaço alargando.
* Padrão de reversão de alta - preço perdendo momentum descendente.
* Negociação: Aguarde o rompimento do limite superior, entre comprado.
6. Triângulo Divergente (Triângulo Alargando) 🔺
* Limite superior inclina para cima, limite inferior inclina para baixo.
* Padrão de expansão de alta volatilidade.
* Negociação: Extremamente arriscado, aguarde um rompimento direcional claro.
7. Triângulo Ascendente (Expansivo) 📊
* Limite superior horizontal, limite inferior inclina para cima.
* Continuação de alta com faixa em expansão.
* Negociação: Comprar rompimento do limite superior.
8. Triângulo Descendente (Expansivo) 📊
* Limite inferior horizontal, limite superior inclina para baixo.
* Continuação de baixa com faixa em expansão.
* Negociação: Vender rompimento do limite inferior.
CUNHAS CONTRATANTES (Formações Convergentes) 🔻
9. Cunha Ascendente (Contratante) 🔺
* Ambos os limites inclinam-se para cima, com um espaço estreitando.
* Padrão de reversão de baixa - exaustão de alta ⚠️
* Negociação: Venda no rompimento do limite inferior.
10. Cunha Descendente (Contratante) 🔻
* Ambos os limites inclinam-se para baixo, com um espaço estreitando.
* Padrão de reversão de alta - exaustão de baixa ⚠️
* Negociação: Compra no rompimento do limite superior.
TRIÂNGULOS CONTRATANTES (Formações de Consolidação) △
11. Triângulo Convergente (Triângulo Simétrico) ⚖️
* Limite superior inclina para baixo, limite inferior inclina para cima em taxa semelhante.
* Consolidação neutra - padrão de continuação.
* Negociação: Aguarde a direção do rompimento, negocie conforme.
12. Triângulo Descendente (Contratante) 📐
* Limite inferior horizontal (suporte), limite superior inclina para baixo.
* Padrão de continuação de baixa 🔴
* Negociação: Venda no rompimento do suporte com volume.
13. Triângulo Ascendente (Contratante) 📐
* Limite superior horizontal (resistência), limite inferior inclina para cima.
* Padrão de continuação de alta 🟢
* Negociação: Compra no rompimento da resistência com volume.
14. Inválido/Desconhecido ❌
* Padrões que não atendem aos critérios geométricos.
* Filtrados automaticamente.
Resumo
Key functionalities include identifying potential breakout zones, visualizing market structure through geometric price relationships, and supporting trading of continuation and reversal patterns with visual confirmation. Users can filter detected patterns by trend direction, pivot type, and formation category. The indicator prevents overlapping and duplicate patterns to maintain clarity.
The 14 detected formations cover a range of classical patterns such as ascending, descending, and ranging channels; expanding and contracting wedges; and various triangle types (converging, diverging, ascending, descending). Visual outputs include color-coded boundary lines, pivot numbering, zigzag swing lines, and labeled pattern names for easy interpretation. This tool supports analysis across multiple markets including Forex, stocks, commodities, indices, and cryptocurrencies.
Avaliações de clientes
5 | 50 % | |
4 | 50 % | |
3 | 0 % | |
2 | 0 % | |
1 | 0 % |


