Descrição
Indicadores da loja Pinescriptlabs: cBots da loja Pinescriptlabs : (cBot) Gold & BTC BreakoutSession Pivots(novo)
PRICE ACTION (Novo)
Prediction Based on Linreg & ATR
SmartTrend Support &
Resistance
Lines
Dynamic
Market Structure
Analysis
of
Turning
Points
Fibonacci
Linear
Regression
Multi-timeframe
Multi-Level
Candle Bias
Tracker
Auto
Support and
Resistance
Trend
Lines
All
Support and
Resistance
Levels
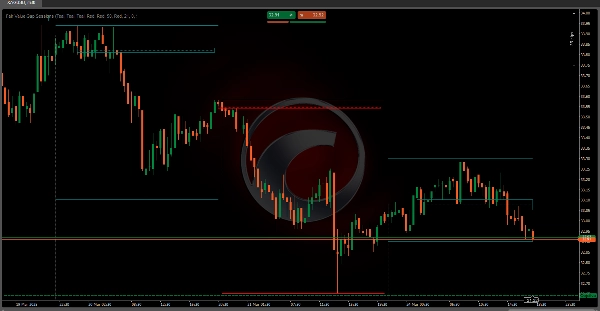
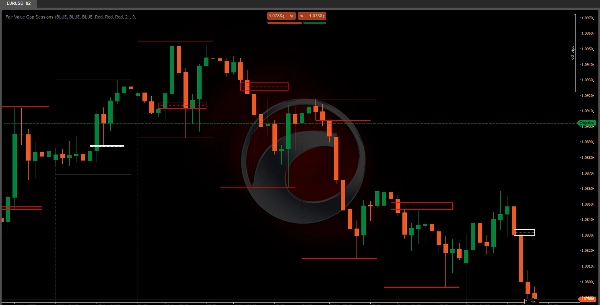
Fair Value Gap Sessions 📊💰
O indicador Fair Value Gap (FVG) é uma ferramenta de negociação sofisticada projetada para identificar e destacar ineficiências temporárias do mercado conhecidas como "lacunas de valor justo" 🚨 dentro de sessões de negociação específicas. Essas lacunas representam momentos em que o preço do mercado se move rapidamente ⚡, criando um desequilíbrio entre compradores e vendedores.
Mecanismos Técnicos Principais 🔧
Arquitetura Baseada em Sessão 🕒
• Implementa uma abordagem precisa e configurável de análise baseada em sessões
• Permite que os traders definam horários personalizados de início de sessão com suporte a UTC ou fuso horário local 🌍
• Cria um limite dinâmico de sessão que se reinicia e acompanha o comportamento do mercado 🔄
Lógica de Detecção de Lacunas de Valor Justo 🔎
• Usa análise avançada de ação de preço em múltiplas barras de preço consecutivas
• Identifica lacunas comparando:
o Preços máximos e mínimos das barras consecutivas 📈📉
o Preço de fechamento da barra anterior ✅
o Estrutura de preço da barra atual 🔄
Classificação das Lacunas 🏷️
O indicador distingue entre dois tipos principais de lacunas:
- Lacuna de Valor Justo de Alta 📈
o Ocorre quando o preço salta acima da máxima anterior 🔺
o Indica potencial momentum de alta no mercado 🚀
o Sinaliza possível pressão de compra 💸 - Lacuna de Valor Justo de Baixa 📉
o Ocorre quando o preço cai abaixo da mínima anterior 🔻
o Sugere potencial momentum de baixa no mercado ⬇️
o Sinaliza possível pressão de venda 🛑
Aplicações de Negociação 📱💼
Insights Estratégicos 💡
• Ajuda os traders a visualizar ineficiências do mercado 🖼️
• Fornece alerta antecipado de possíveis reversões de tendência ⚠️
• Oferece identificação precisa de pontos de entrada e saída 🎯
Recursos de Gestão de Risco 🛡️
• Visualização codificada por cores dos estados da lacuna 🎨
• Acompanha a "mitigação" da lacuna (quando o preço retorna à zona da lacuna) ↔️
• Permite configurações de cores personalizáveis para diferentes condições de mercado 🎨
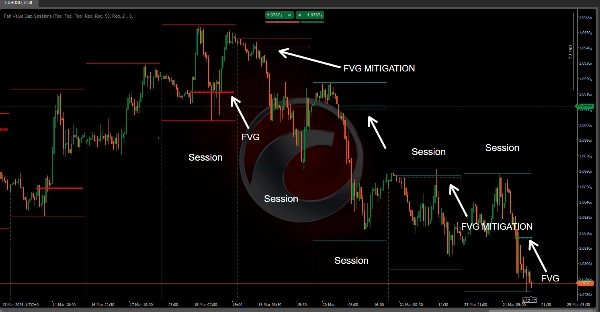
Visualização Técnica 🎨
O indicador cria dois elementos visuais principais:
- Retângulo da Área da Lacuna 🟩
o Representa a faixa de preço da lacuna identificada 📐
o Estende-se dinamicamente durante toda a sessão de negociação ➡️
o Muda de cor com base no status da lacuna (ativa/mitigada) 🟩➡️🟨 - Linha de Nível 📏
o Posicionada no ponto médio da lacuna ⚫
o Ajuda os traders a identificar rapidamente a zona central de preço da lacuna 📍
o Usa diferentes estilos de linha para indicar o estado da lacuna ➔
Estratégias Práticas de Negociação 📝
Estratégias de Sinal de Entrada 🚦
• Use a detecção de lacunas como um sinal potencial de continuação de tendência 🔄
• Procure o retorno do preço para (mitigar) a lacuna como confirmação ✅
• Combine com outros indicadores técnicos para uma tomada de decisão robusta 🤝
Técnicas de Gestão de Risco 🛡️
• Defina stop-loss próximo aos limites da lacuna ⛔
• Use o ponto médio da lacuna como nível potencial de suporte/resistência 🪜
• Monitore a mitigação da lacuna como um indicador potencial de reversão de tendência ↔️⚠️
Flexibilidade de Configuração ⚙️
• Horário de início de sessão personalizável ⏰
• Configuração de fuso horário (UTC/Local) 🌍
Ao entender e implementar corretamente o indicador Fair Value Gap Sessions, os traders podem obter insights mais profundos sobre a dinâmica do mercado, identificar oportunidades potenciais de negociação e tomar decisões mais informadas baseadas nas ineficiências da ação do preço. 🧠📈
Resumo
It classifies gaps into two types: bullish gaps, indicating potential upward momentum and buying pressure, and bearish gaps, signaling possible downward momentum and selling pressure. Visually, it represents gaps with dynamic rectangles showing the price range and a midpoint level line to help traders quickly locate the gap's central price zone. Colors and line styles change to reflect the gap's active or mitigated status.
Traders can use this tool to visualize market inefficiencies, receive early warnings of trend reversals, and identify precise entry and exit points. Risk management features include color-coded gap states, tracking of gap mitigation when price returns to the gap zone, and customizable color settings. The indicator supports practical strategies such as using gap detection for trend continuation signals and combining it with other indicators for decision-making. Stop-loss placement near gap boundaries and monitoring gap mitigation for trend reversal are also supported.
Avaliações de clientes
5 | 100 % | |
4 | 0 % | |
3 | 0 % | |
2 | 0 % | |
1 | 0 % |