
Описание
Pinescritlabs
Индикаторы Ctrader Store: 🤖Pinescritlabs Ctrader Store cBots:
Fair Value Gap Sessions Gold & BTC Breakout Session Pivots(new)
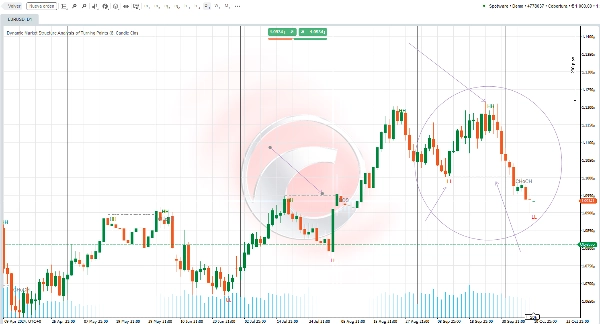
Dynamic Market Structure
Анализ поворотных точек
Fibonacci Linear
Регрессия на нескольких таймфреймах
Multi-Level Candle Bias
Трекер
Auto Support and
Resistance Trend Lines
All Support and
Resistance Levels
Обзор настроек индикатора 🌟
ДЛИНА СВИНГА 📏
Этот параметр определяет, сколько баров учитывается слева и справа при поиске точек свинга. Меньшее значение покажет больше точек, тогда как большее уменьшит их количество. Рекомендуется настраивать этот параметр в зависимости от вашего стиля торговли и при переключении между разными таймфреймами.
CHOCH 🔄
Включение этой опции переименует первый контртрендовый пробой в CHoCH (Change of Character), указывая на возможное изменение направления рынка.
HH и LL 📈📉
Индикатор нанесет на график точки максимума свинга (HH) и минимума свинга (LL), что позволит вам более эффективно визуализировать структуру рынка.
BOS ⚡
Индикатор также отобразит уровни Break of Structure (BOS) при обнаружении пробоев в точках свинга, предоставляя дополнительные сведения о динамике рынка.
Сводка
Отзывы покупателей
5 | 33 % | |
4 | 67 % | |
3 | 0 % | |
2 | 0 % | |
1 | 0 % |


![Логотип продукта "[Hamster-Coder] Moving Average MTF"](https://cdn.ctrader.com/image/webp/b11b98b1-194d-4b8e-b00e-d611826ad159_31226)
