
Описание
🚀 Более 10 000 трейдеров уже используют наши ЛУЧШИЕ индикаторы🏆
Узнайте, почему профессионалы выбирают нас – самые мощные инструменты на cTrader (индикаторы, алгоритмы и cBots) ждут вас.
👉 Получите все наши ЛУЧШИЕ системы здесь:
_______________________________________________
📌 Индикаторы структуры рынка
· ✅ AdvancedMarket Structure: Bos, Choch, SwinLevels, Order Blocks, Market Structure& Liquidity Finder
· 🔄 Динамический анализ структуры рынка поворотных точек
· 🧱 Order Block
· ⚖️ Дисбаланс рынка
· ⛓️ BOS & CHOCH
· 🧠 ICT Power of 3
_______________________________________________
🔚 Системы умного выхода
_______________________________________________
📐 Индикаторы ZigZag
· 🔍 Проекция ликвидности цены ZigZag
· ➖ ZigZag
· 🎯 Трекер экстремумов Zig-Zag
_______________________________________________
🧱 Индикаторы поддержки и сопротивления
· 🟩 Линии поддержки и сопротивления SmartTrend
· 🧱 Все уровни поддержки и сопротивления
_______________________________________________
📊 Индикаторы тренда и каналов
· 📊 Супертренд
· 🧠 Адаптивный трендовый канал
· 🌈 Динамический градиент тренда
· 🔁 Реактивная скользящая средняя
_______________________________________________
💧 Инструменты объема и ликвидности
· 📉 Карта ликвидаций с кредитным плечом
· 🔍 Разрыв справедливой стоимости Momentum
· 🕒 Сессии разрыва справедливой стоимости
_______________________________________________
⚡ Индикаторы Momentum и RSI
· 🚀 Динамический диапазон Momentum
· 🔎 Многоуровневый трекер свечного смещения
Tracker
_______________________________________________
🔮 Инструменты прогнозирования и проекции
· 📐 Прогноз на основе Linreg& ATR
· 📏 Фибоначчи линейная регрессия мультивременной рамки
· 📈 Проектор рыночного потока с поддержкой объема
🟢 Определение Order Blocks 🔴
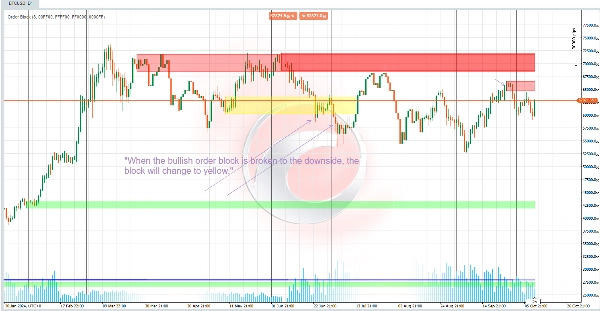
**Бычий Order Block 🚀:**
Чтобы обнаружить бычий order block:
- Код проверяет, превышает ли текущая цена закрытия самый высокий уровень предыдущего свинга ⬆️.
- Если да, и этот свинг еще не был пересечен, он отмечается как пересеченный. Order block затем определяется от самой низкой до самой высокой цены на предыдущих свечах 📈.
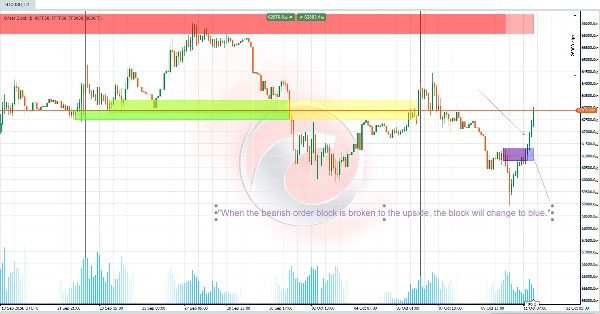
**Медвежий Order Block 🔻:**
- Работает аналогично, но применяется к свингам с низкими ценами.
- Медвежий order block создается, когда текущая цена закрытия опускается ниже самого низкого уровня свинга ⬇️.
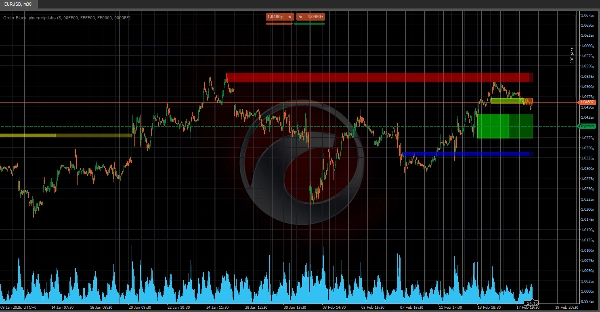
### 💼 Функциональность Order Block 📊
Order Blocks представляют собой **зоны накопления с высоким объемом**, где крупные игроки рынка могли активно торговать
Эти области часто выступают в роли потенциальных уровней поддержки или сопротивления и могут сигнализировать о продолжении или развороте тренда 📉📈.
- **Поддержка или сопротивление:** Прорыв order block может указывать на соответствующие зоны поддержки или сопротивления в зависимости от предыдущего тренда 🔄.
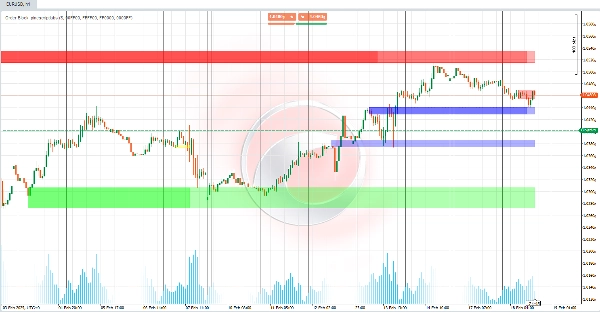
- **Продолжение или разворот:**
- Прорыв order block в противоположном направлении может означать потенциальный разворот 🔄.
- Прорыв в том же направлении может подтвердить продолжение тренда 🔗.
Этот индикатор мощный инструмент для определения **ключевых уровней на графиках** 📈, помогая трейдерам визуализировать важные зоны на основе поведения цены в зонах с высоким объемом. Идеально подходит для выявления трендов и рыночных движений! 🎯📊
Сводка
Отзывы покупателей
5 | 100 % | |
4 | 0 % | |
3 | 0 % | |
2 | 0 % | |
1 | 0 % |


