
VegaXLR - RSI and StochRSI Alerts
Индикатор
15 покупки
Версия 1.0, Apr 2025
Windows, Mac
5.0
Отзывы: 3
Описание
VegaXLR - RSI и StochRSI Alerts — индикатор cTrader, предоставляющий оповещения о событиях RSI и StochRSI, информируя трейдеров о рыночных изменениях. Он уведомляет пользователей о зонах перекупленности/перепроданности, пересечениях центральной линии и пересечениях линий K/D, все с настраиваемыми параметрами.
Ключевые особенности:
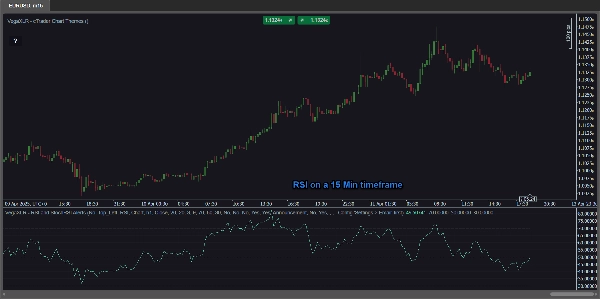
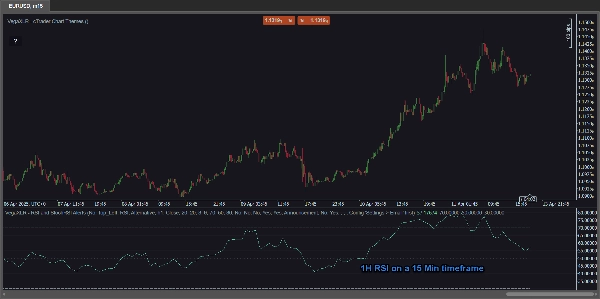
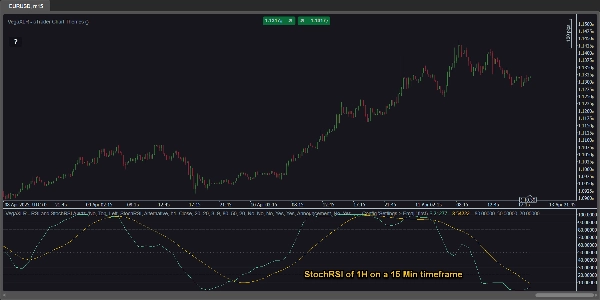
- Мультивременной анализ: Уникальная возможность просматривать значения RSI и StochRSI с любого таймфрейма прямо на вашем текущем графике. Например, анализируйте RSI за 1 час, просматривая 15-минутный график — без изменения таймфрейма!
- Оповещения RSI и StochRSI: Получайте уведомления о:
-
- Перекупленности и перепроданности
- Пересечениях центральной линии (50%)
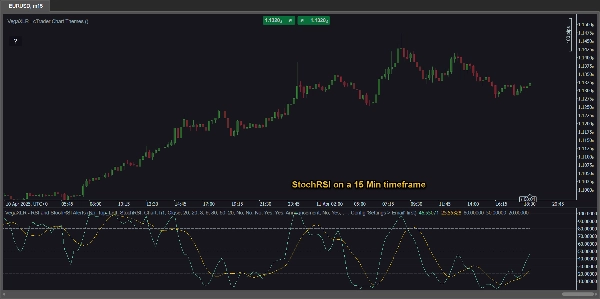
- Пересечениях линий K и D (StochRSI)
- Настраиваемые параметры: Регулируйте источник RSI, периоды, значения K/D и пороги оповещений для точного контроля.
- Универсальные оповещения: Выбирайте из:
-
- всплывающих окон cTrader
- звуковых оповещений
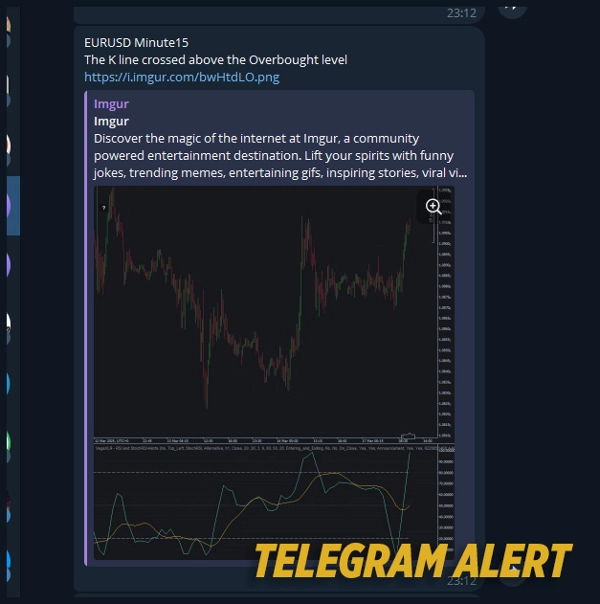
- оповещений в Telegram (с опциональными скриншотами графика)
- уведомлений по электронной почте
- Встроенные линии RSI и StochRSI: Дополнительные индикаторы не нужны — они уже встроены!
Руководство с мгновенным доступом: Удобная кнопка прямо на графике открывает руководство пользователя.
Сводка
ИИ-сводка
VegaXLR - RSI and StochRSI Alerts is a cTrader indicator designed to monitor and notify traders of key RSI and StochRSI events. It provides alerts for overbought and oversold conditions, centerline (50%) crossovers, and K/D line crossovers within the StochRSI. The indicator supports multi-timeframe analysis, allowing users to view RSI and StochRSI values from any timeframe directly on their current chart without switching timeframes. Customizable settings enable adjustment of RSI source, periods, K/D values, and alert thresholds for tailored monitoring. Alert delivery options include cTrader popups, sound alerts, Telegram notifications (with optional chart screenshots), and email messages. The indicator integrates RSI and StochRSI lines internally, eliminating the need for additional indicators. An in-chart button provides instant access to the user manual for guidance. This tool assists traders in identifying precise market shifts and potential trade entry points based on momentum indicators.
Профиль индикатора
Отзывы покупателей
5.0
Отзывы: 3
5 | 100 % | |
4 | 0 % | |
3 | 0 % | |
2 | 0 % | |
1 | 0 % |
Отзывы покупателей
April 27, 2025
Steady choice for testing for traders who use momentum confirmation. It gives value around oscillator setups, but strong trends can keep signals stretched. A clean test needs 25 oscillator signals, 2 timeframe confirmation and a clear 1R exit plan. The tool is useful when overbought or oversold is treated as context, not a command.
April 26, 2025
April 26, 2025
Good enough to inspect for oscillator setups. it gives a familiar read on overextension and momentum, especially when used for checking stretched conditions before entries. RSI style levels around 30 and 70 help, but I would add a 2 swing divergence check. The tool is useful when overbought or oversold is treated as context, not a command.
Обсуждение
Частые вопросы
RSI
Продукты, доступные в cTrader Store, включая торговых ботов, индикаторы и плагины, предоставляются сторонними разработчиками и доступны исключительно в информационных и технических целях. cTrader Store не является брокером и не предоставляет инвестиционные консультации, персональные рекомендации или какие-либо гарантии будущей доходности.


Цена
215
Продажи
677
Бесплатные установки