
VegaXLR - cTrader Chart Themes
Chỉ báo
336 lượt tải
Phiên bản 1.1, Nov 2025
Windows, Mac
5.0
Đánh giá: 3
Mô tả
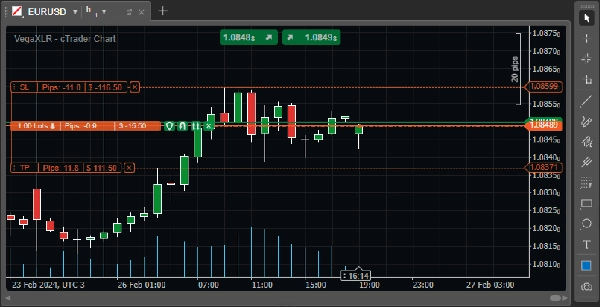
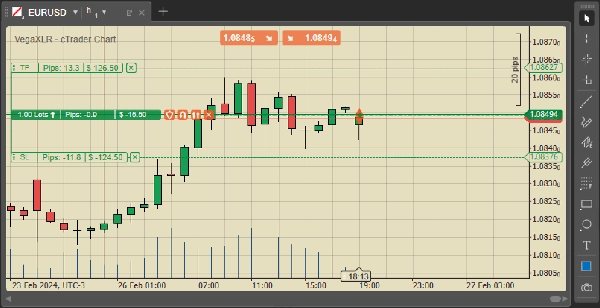
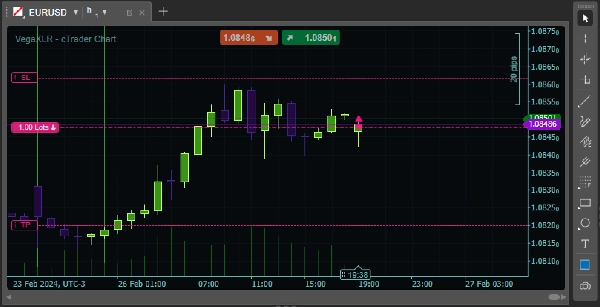
Đây là một gói miễn phí gồm chủ đề biểu đồ cTrader. Những chủ đề này sẽ không làm thay đổi cấu hình của các mẫu biểu đồ của bạn, chúng chỉ thay đổi màu sắc của biểu đồ.
Cách áp dụng:
- Cài đặt tệp như bất kỳ chỉ báo nào khác—chỉ cần nhấp đúp vào nó.
- Thêm chỉ báo vào biểu đồ của bạn.
- Chọn chủ đề bạn ưa thích.
- Khi bạn hài lòng với chủ đề, hãy gỡ chỉ báo khỏi biểu đồ.
- Lưu chủ đề dưới dạng mẫu biểu đồ. Bạn đã hoàn tất!
Bạn đang tìm kiếm thêm công cụ cTrader? Hãy xem phần "Thêm từ tác giả này" bên dưới. Bạn sẽ tìm thấy nhiều chỉ báo và cBot đa dạng, bao gồm cảnh báo trung bình động, hồ sơ khối lượng phạm vi cố định, cảnh báo đường xu hướng, và nhiều hơn nữa!
Tóm tắt
Tóm tắt AI
VegaXLR - cTrader Chart Themes is a free pack of customizable chart color themes designed for the cTrader trading platform. The product allows users to change the visual color scheme of their charts without altering any existing chart template configurations. Installation involves adding the indicator to a chart, selecting a preferred theme, then removing the indicator and saving the theme as a chart template. This tool supports various market types including Forex, Indices, Commodities, Crypto, and Stocks, providing a straightforward way to personalize chart appearance across these markets on cTrader.
Hồ sơ chỉ báo
Đánh giá của khách hàng
5.0
Đánh giá: 3
5 | 100 % | |
4 | 0 % | |
3 | 0 % | |
2 | 0 % | |
1 | 0 % |
Đánh giá của khách hàng
March 31, 2026
September 18, 2025
Thảo luận
Câu hỏi thường gặp
Prop
Forex
Indices
Commodities
Crypto
Stocks
Các sản phẩm có sẵn trên cTrader Store, bao gồm bot giao dịch, chỉ báo và plugin, được cung cấp bởi các nhà phát triển bên thứ ba và chỉ nhằm mục đích cung cấp thông tin và tiếp cận kỹ thuật. cTrader Store không phải là nhà môi giới và không cung cấp lời khuyên đầu tư, khuyến nghị cá nhân hay bất kỳ đảm bảo nào về hiệu suất trong tương lai.


![Logo "[Hamster-Coder] Moving Average MTF"](https://cdn.ctrader.com/image/webp/b11b98b1-194d-4b8e-b00e-d611826ad159_31226)
Giá
231
Lượt bán
694
Cài đặt miễn phí