
Description
| ALL IN ONE TRADING PRO|
## Qu'est-ce que cet indicateur ?
Cet indicateur place **trois outils de trading utiles** sur votre graphique en même temps. Pensez-y comme si vous aviez trois traders experts vous donnant leur avis simultanément
=====================================================
## Les Trois Outils
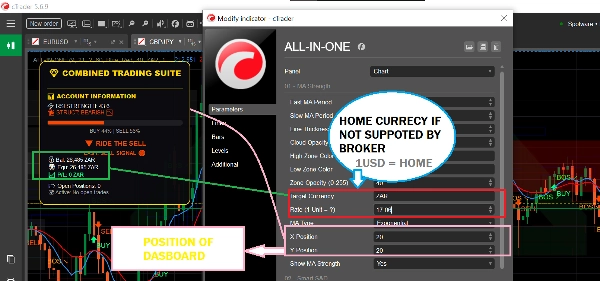
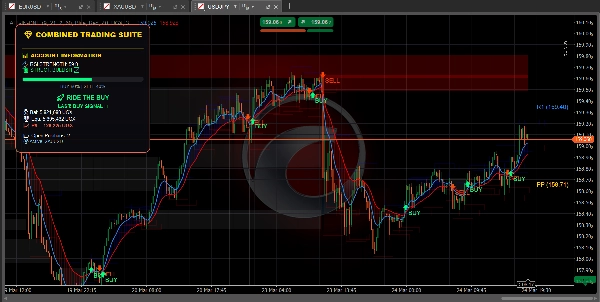
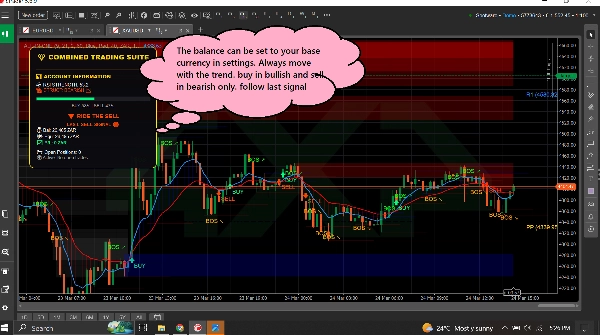
### 1. TABLEAU DE TENDANCE (Le Suiveur de Tendance)
**Ce qu'il fait :** Indique dans quelle direction le marché évolue et la force du mouvement.
**Ce que vous voyez :**
- **Ligne bleue** = Moyenne mobile rapide (tendance à court terme)
- **Ligne rouge** = Moyenne mobile lente (tendance à long terme)
- **Nuage bleu** = Tendance haussière (prix en hausse)
- **Nuage rouge** = Tendance baissière (prix en baisse)
- **Flèche verte** = Signal d'ACHAT apparaît
- **Flèche rouge** = Signal de VENTE apparaît
- **Barre RSI** = Montre si le marché est suracheté (trop haut) ou survendu (trop bas)
========================================================
**Montre aussi :**
- Votre solde de compte et vos gains/pertes
- Combien de positions vous avez ouvertes
- Conseils simples en texte comme "SÛR D'ACHETER" ou "SUIVRE L'ACHAT"
============================================================
### 2. ZONES D'OFFRE & DE DEMANDE (Le Trouveur de Niveaux Clés)
**Ce qu'il fait :** Trouve des niveaux de prix importants où le marché pourrait inverser ou stagner.
**Ce que vous voyez :**
- **Boîtes bleues** = Zones de demande (zones où les acheteurs interviennent - BON pour acheter)
- **Boîtes rouges** = Zones d'offre (zones où les vendeurs interviennent - BON pour vendre)
- **Boîtes grises** = Zones testées (moins fiables)
============================================================
**Comment l'utiliser :**
- Le prix descend vers une boîte bleue ? Cherchez à ACHETER
- Le prix monte vers une boîte rouge ? Cherchez à VENDRE
- Les boîtes fraîches (claires) fonctionnent mieux que les grises
============================================================
**Montre aussi :**
- **BOS ↗** = Le marché a cassé à la hausse, la tendance peut continuer vers le haut
- **BOS ↘** = Le marché a cassé à la baisse, la tendance peut continuer vers le bas
============================================================
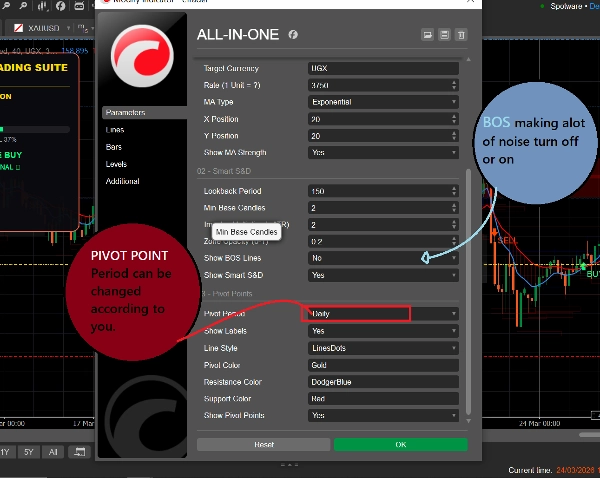
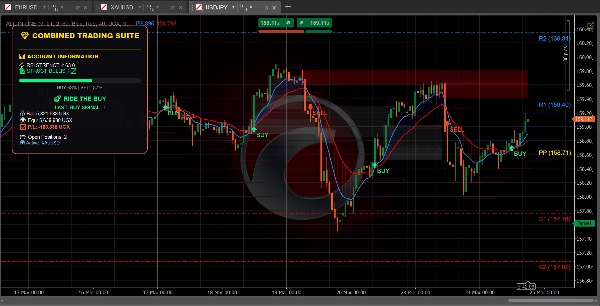
### 3. POINTS PIVOTS (Les Niveaux de Support & Résistance)
**Ce qu'il fait :** Calcule automatiquement les niveaux de prix où le marché s'arrête ou se retourne souvent.
**Ce que vous voyez :**
- **Ligne dorée** = Point pivot (niveau central)
- **Lignes bleues** = Niveaux de résistance (le prix peut baisser ici)
- **Lignes rouges** = Niveaux de support (le prix peut monter ici)
============================================================
**Vous pouvez choisir :**
- **Quotidien** = Les niveaux changent une fois par jour
- **Hebdomadaire** = Les niveaux changent une fois par semaine
- **Mensuel** = Les niveaux changent une fois par mois
- **15 minutes** = Les niveaux changent toutes les 15 minutes (bon pour le trading rapide)
============================================================
## Comment l'utiliser (Simple)
### Pour trouver un trade d'ACHAT :
1. Attendez que le prix atteigne une **boîte de demande bleue**
2. Vérifiez si la ligne MA bleue est au-dessus de la ligne MA rouge (tendance haussière)
3. Les signaux ne doivent être suivis que si le marché est dans la bonne tendance
============================================================
### Pour trouver un trade de VENTE :
1. Attendez que le prix atteigne une **boîte d'offre rouge**
2. Vérifiez si la ligne MA rouge est au-dessus de la ligne MA bleue (tendance baissière)
3. Les signaux ne doivent être suivis que si le marché est dans la bonne tendance
============================================================
### Pour trouver des trades rapides :
1. Utilisez les points pivots de 15 minutes pour des niveaux précis
2. Surveillez les flèches BOS pour la direction de la tendance
3. Vérifiez le tableau de bord pour la force du marché
4. Prenez des trades qui correspondent à la direction
============================================================
## Que signifient toutes les couleurs
| Couleur | Ce que ça signifie |
| 🟦 Bleu | Haussier / Signaux d'achat / Zones de demande / Pivots de résistance |
| 🔴 Rouge | Baissier / Signaux de vente / Zones d'offre / Pivots de support |
| 🟨 Or | Point pivot (niveau central) |
| ⚪ Gris | Zones testées (déjà visitées) |
| 🟢 Flèche verte | Signal d'ACHAT |
| 🔴 Flèche rouge | Signal de VENTE |
============================================================
## Paramètres simples pour débutants
============================================================
### Pour le trading rapide (Scalping) :
- Période pivot : **15 minutes**
- MA rapide : **5**
- MA lente : **13**
- Activez : Les trois outils
============================================================
### Pour le trading journalier :
- Période pivot : **Quotidien**
- MA rapide : **9**
- MA lente : **21**
- Activez : Les trois outils
============================================================
### Pour le trading à long terme :
- Période pivot : **Hebdomadaire**
- MA rapide : **21**
- MA lente : **55**
- Activez : Tableau de tendance + Points pivots
=========================================================
## Une règle à retenir
=========================================================
**Ne tradez pas lorsque les outils ne sont pas d'accord !**
Si le tableau de bord indique ACHAT, mais que le prix est dans une zone d'offre rouge - attendez la clarté.
Si le tableau de bord indique VENTE, mais que le prix est dans une zone de demande bleue - attendez la clarté.
Les meilleurs trades se produisent lorsque TOUS les outils pointent dans la même direction.
============================================================
## Démarrage rapide
1. Ajoutez l'indicateur à votre graphique
2. Gardez tous les paramètres par défaut au début
3. Observez comment le prix se comporte aux boîtes et lignes colorées
4. Après quelques jours, ajustez les paramètres pour correspondre à votre style
5. Utilisez le tableau de bord pour surveiller votre compte en temps réel
============================================================
C'est tout ! Trois outils, un indicateur, un trading simple.
Résumé
1. Trend Dashboard: Displays short-term (blue line) and long-term (red line) moving averages, colored clouds indicating uptrend (blue) or downtrend (red), buy (green arrow) and sell (red arrow) signals, and an RSI bar showing overbought or oversold conditions. It also shows account balance, open positions, and simple text advice.
2. Supply & Demand Zones: Highlights important price levels with blue boxes for demand zones (buying areas), red boxes for supply zones (selling areas), and gray boxes for tested zones (less reliable). It includes breakout signals (BOS arrows) indicating potential trend continuation.
3. Pivot Points: Automatically calculates support and resistance levels with a gold pivot point line, blue resistance lines, and red support lines. Users can select pivot periods from 15-minute to monthly intervals for different trading styles.
The indicator supports multiple markets including Forex, Crypto, Stocks, and Indices, and provides visual signals such as crossovers, breakouts, and level touches. It is designed for various trading styles, from scalping to long-term trading, with recommended settings for each. The tool emphasizes trading only when all three components align in direction to improve trade clarity and consistency.
Avis clients
5 | 100 % | |
4 | 0 % | |
3 | 0 % | |
2 | 0 % | |
1 | 0 % |


