
Description
Indicateur de Fair Value Gap
Aperçu
L'indicateur Fair Value Gap est un outil de précision pour les traders axés sur l'action des prix qui souhaitent identifier, suivre et valider les déséquilibres du marché à court terme. Il détecte automatiquement les Fair Value Gaps (FVG) haussiers et baissiers, met en évidence les zones actives (non atténuées) sur votre graphique, et enregistre lorsque le prix comble (atténue) ces zones par la suite. Léger et non repeint (fonctionne sur des barres closes), cet indicateur est conçu pour une analyse fiable en trading en direct et en backtesting.
Caractéristiques principales
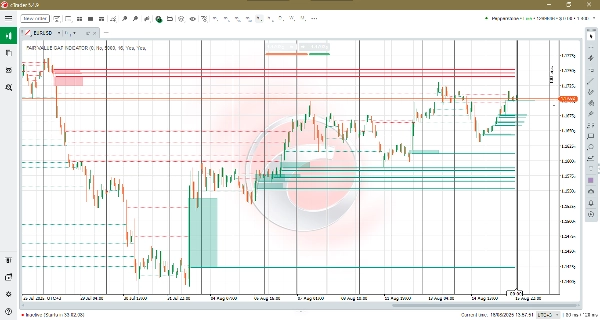
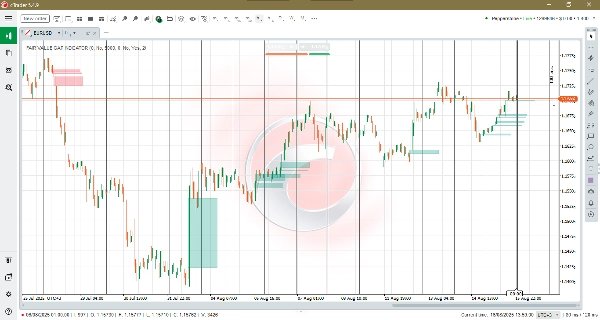
- Détection automatique des FVG : Une logique robuste sur 3 barres identifie à la fois les zones de déséquilibre haussières et baissières et trace des zones rectangulaires nettes sur le graphique.
- Suivi de l'atténuation : Lorsque le prix clôture à travers une zone, l'indicateur supprime la boîte et peut dessiner une ligne pointillée d'atténuation persistante pour référence historique.
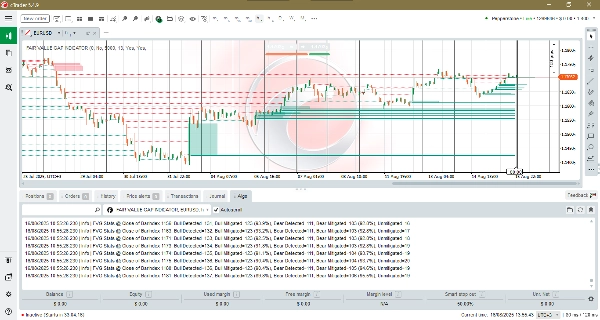
- Superposition des niveaux non atténués : Affiche les N niveaux non comblés les plus récents sous forme de lignes horizontales épaisses tracées depuis la barre de détection jusqu'à la barre en formation actuelle. Cela facilite la visualisation des Fair Value Gaps actifs (non atténués) et l'identification rapide de leurs niveaux de prix.
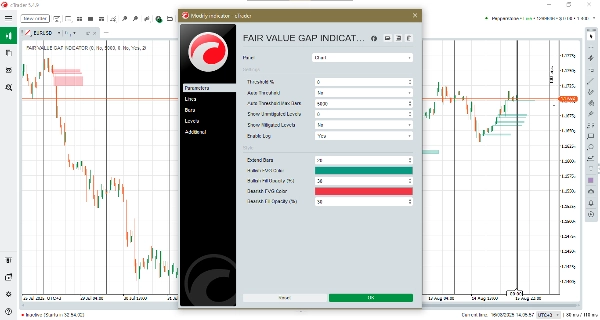
- Seuil manuel & automatique : Choisissez un seuil relatif fixe ou activez le seuil automatique pour que l'indicateur s'adapte à l'activité récente du marché.
- Nombre maximal de barres pour le seuil automatique : Contrôle la taille de la fenêtre glissante utilisée pour calculer le seuil automatique. Des valeurs plus grandes lissent le seuil (stable sur une plus longue période) ; des valeurs plus petites le rendent plus réactif à la volatilité récente.
- Visuels personnalisés & projection : Définissez la longueur d'extension (jusqu'où les boîtes se projettent), la couleur et l'opacité de remplissage pour les zones haussières et baissières afin de correspondre au style de votre graphique.
- Journalisation dans le terminal : Des lignes de journal compactes rapportent le total des FVG détectés, les atténuations et les comptes actuels non atténués — idéal pour la validation et l'ajustement de stratégie.
- Logique sur barres closes : Conçu pour s'exécuter une fois par barre close afin de minimiser le repeint.
Avantages
- Références claires pour le trading : Trouvez rapidement des zones de déséquilibre qui peuvent servir de cibles de retour, de zones de réaction ou de références pour la gestion des trades.
- Validation & statistiques : Utilisez les journaux du terminal et les pourcentages d'atténuation pour valider les signaux et ajuster la sensibilité de votre stratégie.
- Sensibilité adaptable : Le seuil automatique + nombre maximal de barres permet à l'indicateur de fonctionner de manière fiable sur des marchés calmes et volatils sans réajustements manuels constants.
- Visuels compacts & non intrusifs : Une empreinte visuelle minimale garde vos graphiques lisibles tout en préservant le contexte essentiel.
Idéal pour
Les day traders, swing traders et scalpers qui s'appuient sur l'action des prix et les concepts de déséquilibre, ainsi que les analystes validant les réactions du flux d'ordres et la performance des stratégies.
Conclusion
L'indicateur Fair Value Gap combine une détection précise des déséquilibres avec des analyses d'atténuation et un seuil adaptatif, vous offrant une vue ciblée et peu bruitée des déséquilibres du marché. Utilisez-le pour repérer les retours potentiels de prix, gérer les trades plus intelligemment et mesurer la fréquence à laquelle les zones sont comblées sur votre marché.
Résumé
Key features include automated FVG detection, mitigation tracking, and an overlay showing recent unmitigated levels as bold horizontal lines for easy visual scanning. Users can select manual or automatic thresholding to adapt sensitivity to market conditions, with adjustable parameters controlling the responsiveness of the auto threshold. Customizable visual settings allow traders to tailor the appearance of bullish and bearish zones.
The indicator operates on closed bars to minimize repainting, ensuring reliable signals for live trading and backtesting. Terminal logging provides concise statistics on detected gaps and mitigations, aiding validation and strategy tuning.
Suitable for day traders, swing traders, scalpers, and analysts, the Fair Value Gap Indicator supports markets including Forex, indices, commodities, cryptocurrencies, and stocks. It offers a focused, low-noise view of market imbalances to assist in identifying potential price return targets and managing trades.
Avis clients
5 | 100 % | |
4 | 0 % | |
3 | 0 % | |
2 | 0 % | |
1 | 0 % |


