
CVD
Indicateur
2 achats
Version 1.0, Dec 2025
Windows, Mac
4.5
Avis : 2
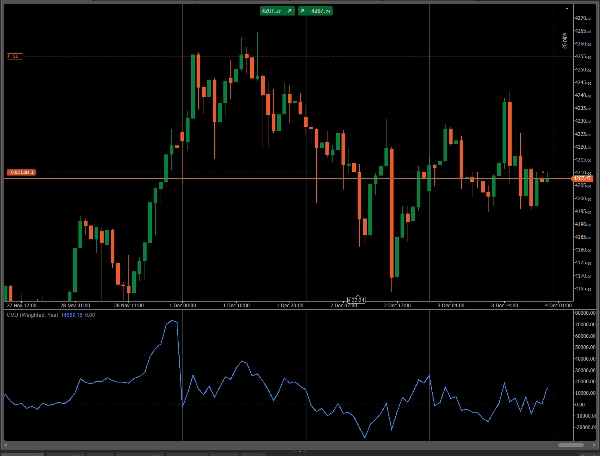
Delta de volume cumulatif est un indicateur de trading qui suit la différence nette entre la pression d'achat et de vente au fil du temps en accumulant les données de volume
Profil de l'indicateur
4.5
Avis : 2
5 | 50 % | |
4 | 50 % | |
3 | 0 % | |
2 | 0 % | |
1 | 0 % |
Avis clients
December 11, 2025
Works better when the trader stays patient. 20 reactions is a fair first sample.
Signal
Les produits disponibles sur cTrader Store, notamment les bots de trading, les indicateurs et les plug-ins, sont fournis par des développeurs tiers et mis à disposition à titre informatif et à des fins d'accès technique uniquement. cTrader Store n'est pas un courtier et ne fournit aucun conseil en investissement, aucune recommandation personnelle ni aucune garantie quant aux performances futures.


![Logo de "[CB] Pivot Points Pro"](https://cdn.ctrader.com/image/webp/43463c82-67b0-4f10-a4ba-901bba091d81_32594)


Depuis le 29/06/2025
2
Ventes
13
Installations gratuites