
说明
经典比例CVD(锚定)
通过经典比例CVD解锁市场参与者的真实意图。与简单累加成交量的标准累计成交量差指标不同,该工具使用比例逻辑根据每根K线内的实际价格行为来加权成交量。
为什么是“比例”Delta?
标准CVD可能具有误导性。该指标通过分析K线区间(高-低)与收盘-开盘距离之间的关系来计算Delta。这确保了成交量的分布更加真实:
- 强烈信念的K线(收盘接近高点/低点)对Delta贡献更大。
- 长影线K线(吸收或拒绝的迹象)中和Delta,防止“假”成交量信号。
主要特征
- ⚓ 智能锚定(多时间框架重置): 保持分析与当前交易时段相关。可选择每日、每周或每月重置计算,或保持持续运行。
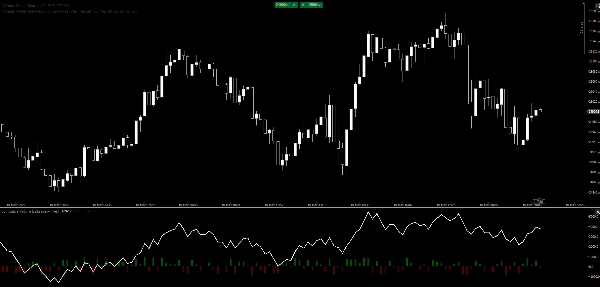
- 📊 双重视觉效果:
-
- CVD线: 一条干净、高性能的线,用于发现长期背离和趋势疲劳。
- 直方图叠加: 即时显示每根K线的买卖压力,快速识别高潮或吸收。
- ⚡ 超轻量级: 使用cTrader原生C#优化编写,确保即使在低端机器或波动市场中也无延迟。
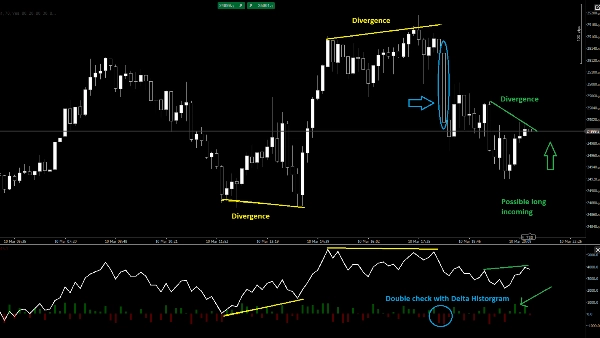
- 🎯 背离识别: 轻松识别价格创新高而CVD未能跟进的情况——这是机构分配的经典信号。
如何使用它进行交易
- 趋势确认: 寻找CVD线与价格同方向的趋势。
- 吸收: 当价格创出新低但CVD直方图显示强烈“Delta上升”(绿色)时,买方正在吸收卖压。
- 疲劳: 注意直方图的急剧峰值(高潮)及随后CVD线的反转。
参数:
- 锚定模式: 从不、每日、每周、每月。
- 显示K线Delta: 切换直方图开关。
通过经典比例CVD解锁市场参与者的真实意图。与简单累加成交量的标准累计成交量差指标不同,该工具使用比例逻辑根据每根K线内的实际价格行为来加权成交量。
为什么是“比例”Delta?
标准CVD可能具有误导性。该指标通过分析K线区间(高-低)与收盘-开盘距离之间的关系来计算Delta。这确保了成交量的分布更加真实:
- 强烈信念的K线(收盘接近高点/低点)对Delta贡献更大。
- 长影线K线(吸收或拒绝的迹象)中和Delta,防止“假”成交量信号。
主要特征
- ⚓ 智能锚定(多时间框架重置): 保持分析与当前交易时段相关。可选择每日、每周或每月重置计算,或保持持续运行。
- 📊 双重视觉效果:
-
- CVD线: 一条干净、高性能的线,用于发现长期背离和趋势疲劳。
- 直方图叠加: 即时显示每根K线的买卖压力,快速识别高潮或吸收。
- ⚡ 超轻量级: 使用cTrader原生C#优化编写,确保即使在低端机器或波动市场中也无延迟。
- 🎯 背离识别: 轻松识别价格创新高而CVD未能跟进的情况——这是机构分配的经典信号。
如何使用它进行交易
- 趋势确认: 寻找CVD线与价格同方向的趋势。
- 吸收: 当价格创出新低但CVD直方图显示强烈“Delta上升”(绿色)时,买方正在吸收卖压。
- 疲劳: 注意直方图的急剧峰值(高潮)及随后CVD线的反转。
参数:
- 锚定模式: 从不、每日、每周、每月。
- 显示K线Delta: 切换直方图开关。
摘要
AI 摘要
The Classic Proportional Cumulative Volume Delta (CVD) indicator enhances traditional CVD analysis by applying proportional logic to volume data based on price action within each bar. Instead of simply summing tick volume, it weighs volume according to the relationship between the bar range (high-low) and the close-open distance. This approach assigns greater delta values to strong conviction candles (closing near highs or lows) and neutralizes delta for wick-heavy candles, reducing misleading volume signals.
Key features include smart anchoring with multi-timeframe resets (daily, weekly, monthly, or continuous), dual visuals comprising a CVD line for spotting divergences and trend exhaustion, and a histogram overlay for immediate per-bar buying or selling pressure insights. The indicator is optimized in native C# for cTrader, ensuring high performance and low resource use.
Traders can use the indicator for trend confirmation by aligning CVD direction with price, identify absorption when price lows coincide with strong positive delta in the histogram, and detect exhaustion through histogram spikes followed by CVD reversals. Adjustable parameters include anchor mode and histogram display toggle.
This tool supports analysis across multiple markets and symbols, including Forex, cryptocurrencies, indices, commodities, and stocks.
指标配置
客户评价
4.0
评价:1
5 | 0 % | |
4 | 100 % | |
3 | 0 % | |
2 | 0 % | |
1 | 0 % |
客户评价
March 21, 2026
Pretty decent as a backup check, especially in challenge trading. It needs a boring test before bigger size.
讨论
常见问答
BTCUSD
Forex
Signal
Breakout
Indices
EURUSD
Commodities
GBPUSD
NZDUSD
Prop
Scalping
Fair Value Gap
SMC
Crypto
Stocks
XAUUSD
NAS100
USDJPY
VWAP
cTrader Store 提供的所有产品,包括交易机器人、指标和插件,均由第三方开发者提供,仅供信息参考和技术访问之用。cTrader Store 并非经纪商,不提供投资建议、个人推荐或任何未来业绩保证。
该作者的其他作品


价格
注册日期 09/05/2025
5
销售