
Deskripsi
💡 Saluran Regresi Linear dan Titik ZigZag 💡
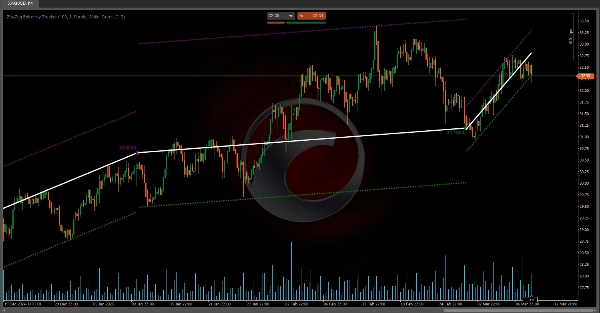
• Saluran regresi linear dihitung ulang dan direset setiap kali harga bergerak melewati batas yang diharapkan (pita), memastikan pengukuran tetap terbaru dengan tren pasar yang sebenarnya.
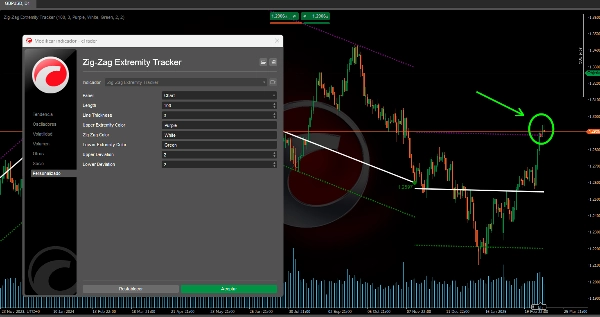
• Titik yang ditandai (lingkaran) mewakili ekstrem (tinggi dan rendah) yang menjadi dasar untuk menggambar ZigZag dan menentukan dari mana saluran dihitung.
• Pendekatan dinamis ini memungkinkan visualisasi yang lebih baik dari potensi perubahan tren, serta area kelebihan beli atau jual di mana harga mungkin berbalik menuju rata-rata.
❓ Bagaimana saluran terkait dengan ZigZag dan titik ekstrem? ❓
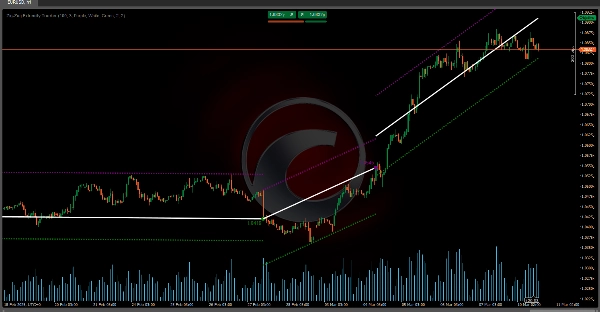
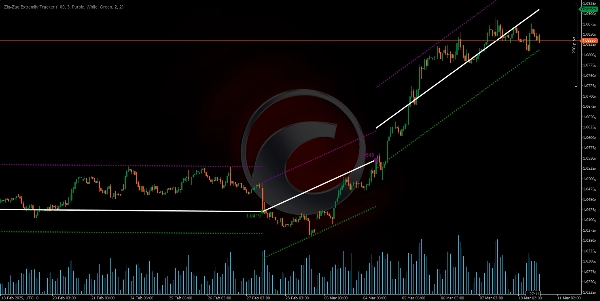
• Setiap kali ekstrem baru (tinggi atau rendah) terdeteksi, indikator tidak hanya menggambar lingkaran dan garis ZigZag yang menghubungkan titik itu dengan yang sebelumnya, tetapi juga menyesuaikan ulang saluran regresi linear potensial yang digambar dari ekstrem terakhir tersebut.
• Jika, selama bar berikutnya, harga tetap berada dalam pita, saluran tetap aktif dan diperpanjang hingga bar saat ini.
• Jika pada suatu titik harga menembus pita tersebut, indikator “menganggap” saluran telah tidak valid dan memulai saluran baru dari bar tempat terjadinya pelanggaran.
Indikator Toko Ctrader:
Struktur Pasar Dinamis
Analisis Titik Balik
Regresi Linear Fibonacci
Multi-timeframe
Bias Lilin Multi-Level
Pelacak
Garis Tren Dukungan dan
Resistensi Otomatis
Semua Tingkat Dukungan dan
Resistensi
Analisis Struktur Pasar Dinamis Titik Balik
Regresi Linear Fibonacci Multi-timeframe
Pelacak Bias Lilin Multi-Level
Garis Tren Dukungan dan Resistensi Otomatis
Ringkasan
Ulasan pelanggan
5 | 50 % | |
4 | 50 % | |
3 | 0 % | |
2 | 0 % | |
1 | 0 % |


![Logo "[Hamster-Coder] Moving Average MTF"](https://cdn.ctrader.com/image/webp/b11b98b1-194d-4b8e-b00e-d611826ad159_31226)


![Logo "[Stellar Strategies] Inside Bar with Signals"](https://cdn.ctrader.com/image/webp/1d9e8bfa-3b2c-4440-bb37-5856902008a7_30683)


