
الوصف
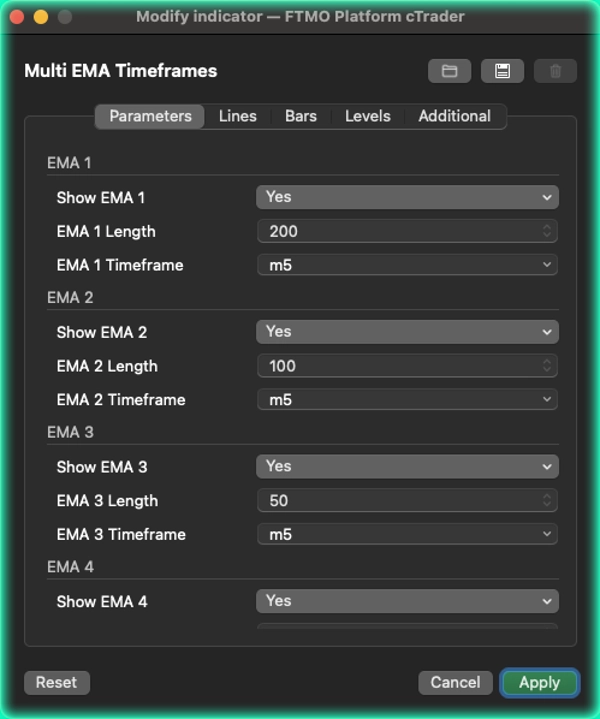
أطر زمنية متعددة لمتوسطات EMA بواسطة [BeyondTrading] الخطأ الأكثر شيوعًا الذي يرتكبه المتداولون مع المتوسطات المتحركة هو تبديل الأطر الزمنية فقط للتحقق من مكان وجود EMA الرئيسي. أطر زمنية متعددة لـ EMA تلغي ذلك تمامًا. تبقى على إطارك الزمني العامل — 5 دقائق، 15 دقيقة، ساعة واحدة — وتحدد بالضبط أي EMA من أي إطار زمني يجب أن يظهر على مخططك، الآن، دون التنقل إلى أي مكان.
أنت على مخطط 5 دقائق وتريد رؤية EMA 200 من الإطار الزمني الساعي؟ تم. هل تريد أيضًا EMA 50 من 15 دقيقة و EMA 20 من الإطار الزمني الحالي جنبًا إلى جنب؟ أيضًا تم. كل من المتوسطات الخمسة يتم تكوينها بشكل مستقل تمامًا: فترتها الخاصة، إطارها الزمني المصدر الخاص بها، لونها الخاص، ومفتاح التشغيل/الإيقاف الخاص بها.
هذا قوي بشكل خاص لإعدادات التوافق. عندما يقترب السعر على إطار الدخول الخاص بك من EMA ينتمي إلى إطار زمني أعلى بكثير، فإن ذلك المستوى يحمل وزنًا هيكليًا حقيقيًا. رؤيته مباشرة على مخططك — دون تبديل علامات التبويب، دون التخمين الثاني للقيمة الدقيقة — يغير كيفية تفاعلك مع تلك المناطق الرئيسية.
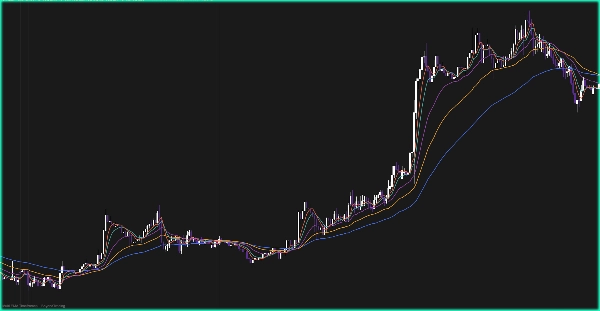
وضعا العرض يتيحان لك التحكم في كيفية رسم الخطوط. وضع الخطوة يجمد كل EMA عند آخر شريط مصدر مغلق بالكامل، لذا لا تتغير القيمة حتى يغلق شريط الإطار الزمني الأعلى — بدون إعادة رسم، موثوق تمامًا لقرارات التداول الحية. الوضع السلس يستخلص بشكل مستمر بين أشرطة المصدر لعرض بصري أنظف، مناسب أكثر للتحليل والمراجعة.
ما الذي يجعله مختلفًا معظم مؤشرات EMA المتعددة تحسب كل شيء على الإطار الزمني الحالي للمخطط. هنا، كل EMA مصدره فعليًا من إطاره الزمني المستقل الخاص. أنت لا تقرب — أنت تقرأ EMA الحقيقي الذي يراه المتداولون على ذلك الإطار الزمني فعليًا.
الميزات
- حتى 5 متوسطات EMA مستقلة تمامًا، كل منها بإطار زمني وفترة خاصة به
- ابق على أي إطار زمني للمخطط أثناء قراءة EMA من أي إطار زمني آخر
- وضع الخطوة: القيم مقفلة على أشرطة المصدر المغلقة، بدون إعادة رسم
- الوضع السلس: استيفاء خطي لانتقالات بصرية سلسة
- مفتاح إظهار/إخفاء لكل EMA للحفاظ على نظافة مخططك في جميع الأوقات
الملخص
تقييمات العملاء
5 | 50 % | |
4 | 50 % | |
3 | 0 % | |
2 | 0 % | |
1 | 0 % |


