
NewsGuard High-Impact News Risk Overlay
Indicatore
2 acquisti
Versione 1.0, Jan 2026
Windows, Mac
5.0
Recensioni: 1
Descrizione
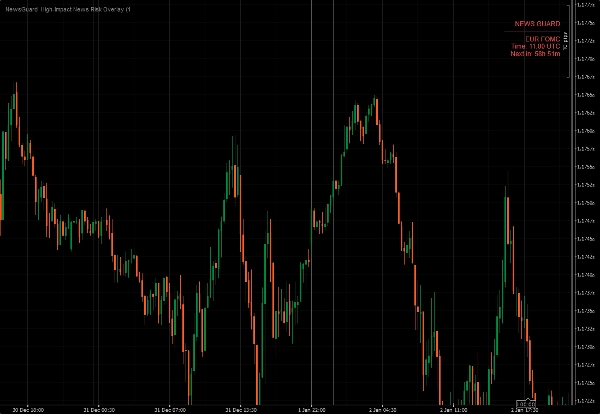
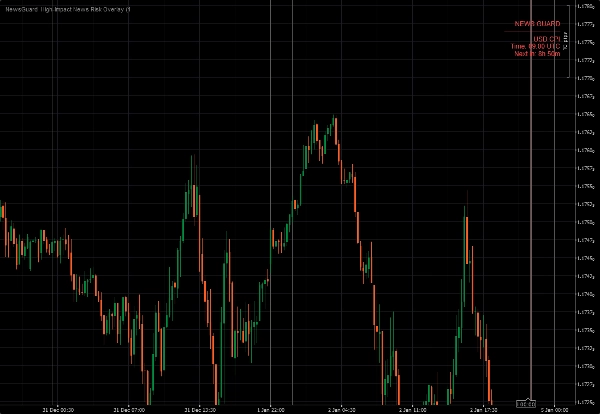
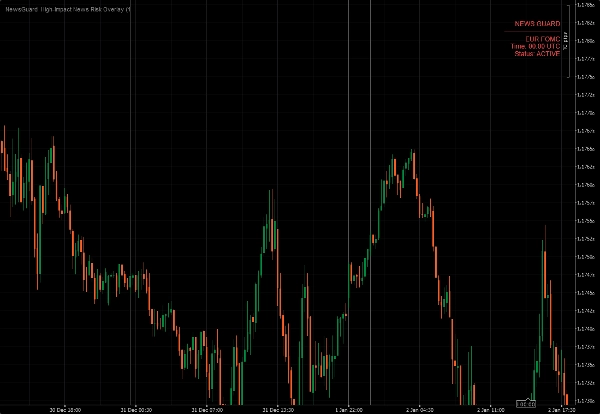
NewsGuard – Sovrapposizione del Rischio Notizie ad Alto Impatto è uno strumento professionale di consapevolezza del rischio per cTrader.
Evidenzia visivamente le finestre temporali intorno ai principali eventi economici noti per causare estrema volatilità, espansione dello spread e slippage.
Invece di reagire dopo che il movimento si verifica, NewsGuard ti avverte prima che il rischio aumenta.
Cosa mostra NewsGuard
- Zone di rischio notizie ad alto impatto direttamente sul grafico
- Finestra temporale regolabile prima e dopo ogni evento
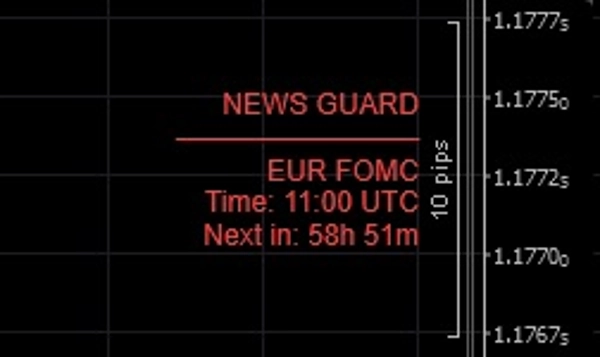
- Sovrapposizione pulita con informazioni sulle notizie imminenti o attive
- Filtraggio automatico della rilevanza basato sul simbolo scambiato
NewsGuard utilizza un calendario manuale ad alto impatto, rendendolo:
- affidabile
- sicuro per l'archiviazione
- indipendente da feed esterni o API
Cosa NON è NewsGuard
- Nessun feed di notizie
- Nessuna previsione
- Nessun segnale di trading
Esiste per un solo scopo:
renderti consapevole del rischio basato sul tempo.
Perfetto per scalper, day trader e chiunque voglia evitare di operare alla cieca durante importanti eventi di notizie.
Riepilogo
Riepilogo AI
NewsGuard High-Impact News Risk Overlay is a risk-awareness indicator designed for the cTrader platform. It visually marks time windows around major economic events known to cause significant market volatility, spread widening, and slippage. The overlay displays high-impact news risk zones directly on trading charts, allowing traders to anticipate periods of increased risk before volatility occurs. Users can adjust the time windows before and after each event to suit their trading preferences. The tool automatically filters news relevance based on the traded symbol, providing a clean and focused overlay with upcoming or active news information. NewsGuard relies on a manually maintained high-impact news schedule, ensuring reliability and independence from external data feeds or APIs. It does not provide news feeds, forecasts, or trade signals; its sole purpose is to enhance trader awareness of time-based risk. This indicator is suitable for scalpers, day traders, and others who want to avoid entering trades blindly during major news events. Supported markets include Forex, indices, and popular symbols such as GBPUSD, XAUUSD (gold), and NAS100.
Profilo indicatore
Recensioni dei clienti
5.0
Recensioni: 1
5 | 100 % | |
4 | 0 % | |
3 | 0 % | |
2 | 0 % | |
1 | 0 % |
Recensioni dei clienti
January 16, 2026
Poor entries are easier to skip, but the tool is just one part of the process.
Discussioni
Domande frequenti
Forex
Breakout
Scalping
Indices
GBPUSD
XAUUSD
NAS100
I prodotti disponibili tramite cTrader Store, inclusi bot di trading, indicatori e plugin, sono forniti da sviluppatori terzi e resi disponibili esclusivamente a scopo informativo e di accesso tecnico. cTrader Store non è un broker e non fornisce consulenze in materia di investimento, raccomandazioni individualizzate o garanzie di risultati futuri.
Altro da questo autore


Prezzo
Da 02/01/2026
2
Vendite