
Descrizione
https://chartshots.spotware.com/c/695be69b1a3ca
https://chartshots.spotware.com/c/695be2a98e848
https://chartshots.spotware.com/c/695be7e8e88fa
https://chartshots.spotware.com/c/695be31346fe7
https://chartshots.spotware.com/c/695be3bd18aea
https://chartshots.spotware.com/c/695be5d5687c7
Auto Chart Patterns
📊 COS'È?
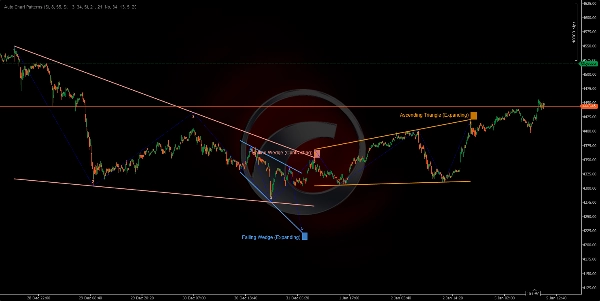
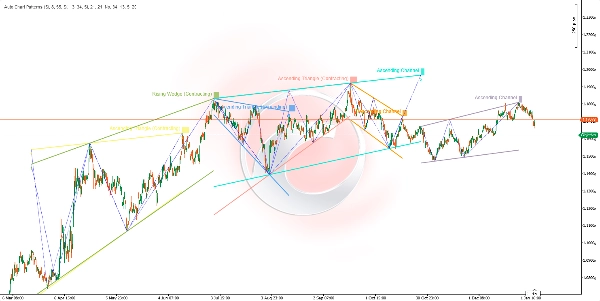
L'indicatore Auto Chart Patterns è uno scanner avanzato di formazioni geometriche che rileva e visualizza automaticamente i classici pattern grafici utilizzando l'analisi dei punti di swing multi-timeframe. Identifica 14 diverse formazioni geometriche, inclusi canali, cunei e triangoli, collegando i massimi e minimi di swing con linee di tendenza, creando un sistema completo di riconoscimento dei pattern.
🎯 A COSA SERVE?
Questo indicatore aiuta i trader a:
- Rilevare automaticamente 14 classici pattern grafici (canali, cunei, triangoli) 📐
- Identificare potenziali zone di breakout prima che si verifichino ⚡
- Visualizzare la struttura del mercato attraverso relazioni geometriche dei prezzi 🔍
- Operare su pattern di continuazione e inversione con conferma visiva ✅
- Filtrare i pattern per direzione del trend e tipo di pivot finale 🎛️
- Analizzare più timeframe di swing simultaneamente per confluenza 🌊
🔍 COME FUNZIONA?
Sistema di Rilevamento dei Punti di Swing 📍
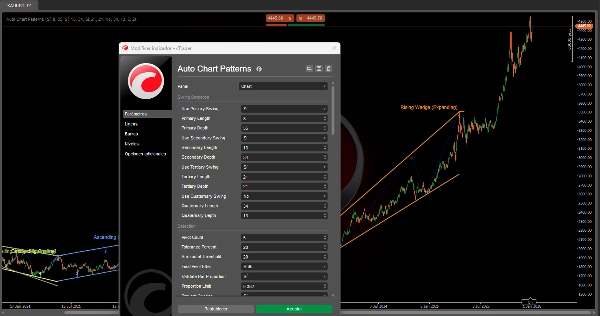
L'indicatore utilizza fino a quattro rilevatori di swing indipendenti che funzionano simultaneamente, ciascuno con sensibilità configurabile:
- Logica di Rilevamento:
-
- Monitora i massimi e minimi dei prezzi su una finestra mobile (Periodo).
- Identifica picchi locali (massimi di swing) e avvallamenti (minimi di swing).
- Conferma gli swing solo dopo che è stato raggiunto un requisito minimo di profondità (per evitare rumore).
- Swing High: Il prezzo fa il massimo più alto nel Periodo, poi scende per
MinDepthbarre. - Swing Low: Il prezzo fa il minimo più basso nel Periodo, poi sale per
MinDepthbarre.
- Quattro Livelli di Swing:
-
- Swing Primario (Default: Lunghezza 8, Profondità 55) - Struttura a lungo termine 🔵
- Swing Secondario (Default: Lunghezza 13, Profondità 34) - Struttura a medio termine 🟢
- Swing Terziario (Default: Lunghezza 21, Profondità 21) - Struttura a breve termine 🟡
- Swing Quaternario (Default: Disabilitato) - Timeframe personalizzato 🟣
Ogni rilevatore può essere abilitato/disabilitato indipendentemente per concentrarsi su specifiche strutture di mercato.
Processo di Formazione del Pattern 🎨
PASSO 1 - RACCOLTA DEI PIVOT:
- Il sistema raccoglie i 5 o 6 punti di swing più recenti da qualsiasi rilevatore attivo.
- I punti devono alternarsi tra massimi e minimi (struttura a zigzag).
- Esempio a 5 punti: Massimo → Minimo → Massimo → Minimo → Massimo.
PASSO 2 - COSTRUZIONE DELLA LINEA DI TENDENZA:
- Separa i pivot in punti superiori (massimi di swing) e punti inferiori (minimi di swing).
- Disegna due linee di tendenza: limite superiore e limite inferiore.
- Per i limiti a 3 punti: testa 3 combinazioni (0-2, 0-1, 1-2) e seleziona la migliore corrispondenza ⭐
- Verifica che le linee di tendenza non penetrino i corpi delle candele (solo stoppini ammessi).
- Calcola un punteggio di adattamento: le linee devono toccare meno del 20% delle barre tra i pivot.
PASSO 3 - ANALISI GEOMETRICA:
- Misura la relazione angolare tra i limiti superiore e inferiore.
- Determina se la formazione è Espandente (allargamento), Contrattante (restringimento), o Parallela (larghezza costante).
- Identifica la direzione del trend: Crescente, Decrescente o Neutrale (orizzontale).
- Classifica in uno dei 14 tipi di formazione basati sulla geometria.
PASSO 4 - VALIDAZIONE E FILTRAGGIO:
- Controllo della Proporzione delle Barre: Garantisce che la spaziatura degli swing sia proporzionale (previene pattern distorti) ✅
- Prevenzione Sovrapposizioni: Blocca nuovi pattern che confliggono con quelli esistenti 🚫
- Controllo Duplicati: Previene il ridisegno dello stesso pattern.
- Filtro Pivot Finale: Mostra solo pattern che terminano con una direzione pivot specificata (Su/Giù/Entrambi).
- Filtro Tipo di Formazione: Abilita/disabilita categorie specifiche di pattern.
PASSO 5 - VISUALIZZAZIONE:
- Disegna le linee di confine superiore e inferiore con colori vivaci da una palette di 12 colori 🎨
- Opzionalmente mostra linee zigzag di swing che collegano i pivot (puntinate blu).
- Mostra i numeri dei pivot (1, 2, 3, 4, 5) in ogni punto di swing.
- Etichetta la formazione con il nome del pattern al pivot finale.
- Colora lo sfondo dietro l'etichetta per chiarezza.
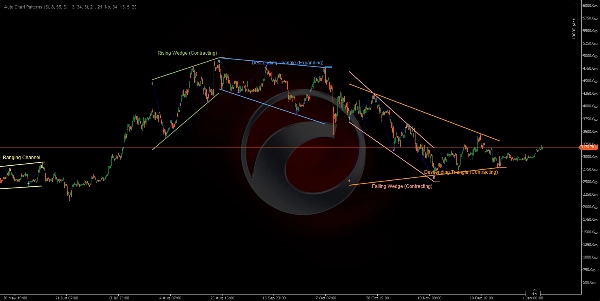
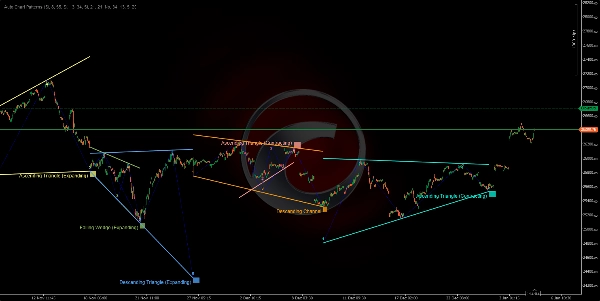
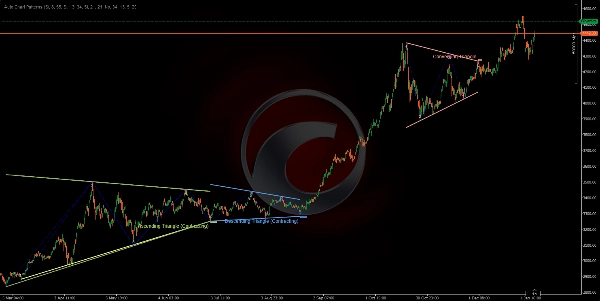
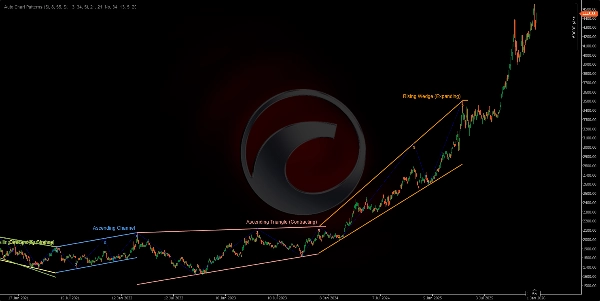
📐 LE 14 FORMAZIONI RILEVATE
CANALI (Formazioni Parallele) 📦
- Canale Ascendente (Parallelo Ascendente) 📈
-
- Entrambi i limiti inclinano verso l'alto con angolo simile.
- Indica un trend di continuazione rialzista.
- Operare: compra al limite inferiore, vendi al limite superiore.
- Canale Discendente (Parallelo Discendente) 📉
-
- Entrambi i limiti inclinano verso il basso con angolo simile.
- Indica un trend di continuazione ribassista.
- Operare: vendi al limite superiore, compra al limite inferiore.
- Canale Laterale (Laterale/Orizzontale) ↔️
-
- Entrambi i limiti sono quasi orizzontali.
- Indica consolidamento o indecisione.
- Operare: strategia range-bound, compra al supporto/vendi alla resistenza.
CUNEI ESPANDENTI (Formazioni ad Allargamento) 📣
4. Cuneo Ascendente (Espandente) ⚠️
* Entrambi i limiti inclinano verso l'alto, con un gap in allargamento.
* Pattern di inversione ribassista - prezzo che perde slancio rialzista.
* Operare: attendere la rottura del limite inferiore, entrare short.
5. Cuneo Discendente (Espandente) ⚠️
* Entrambi i limiti inclinano verso il basso, con un gap in allargamento.
* Pattern di inversione rialzista - prezzo che perde slancio ribassista.
* Operare: attendere la rottura del limite superiore, entrare long.
6. Triangolo Divergente (Triangolo ad Allargamento) 🔺
* Il limite superiore sale, il limite inferiore scende.
* Pattern di espansione ad alta volatilità.
* Operare: estremamente rischioso, attendere una chiara rottura direzionale.
7. Triangolo Ascendente (Espandente) 📊
* Limite superiore orizzontale, limite inferiore sale.
* Continuazione rialzista con range in espansione.
* Operare: compra la rottura del limite superiore.
8. Triangolo Discendente (Espandente) 📊
* Limite inferiore orizzontale, limite superiore scende.
* Continuazione ribassista con range in espansione.
* Operare: vendi la rottura del limite inferiore.
CUNEI CONTRATTIVI (Formazioni a Convergenza) 🔻
9. Cuneo Ascendente (Contrattivo) 🔺
* Entrambi i limiti inclinano verso l'alto, con un gap in restringimento.
* Pattern di inversione ribassista - esaurimento rialzista ⚠️
* Operare: short alla rottura del limite inferiore.
10. Cuneo Discendente (Contrattivo) 🔻
* Entrambi i limiti inclinano verso il basso, con un gap in restringimento.
* Pattern di inversione rialzista - esaurimento ribassista ⚠️
* Operare: long alla rottura del limite superiore.
TRIANGOLI CONTRATTIVI (Formazioni di Consolidamento) △
11. Triangolo Convergente (Triangolo Simmetrico) ⚖️
* Limite superiore scende, limite inferiore sale a ritmo simile.
* Consolidamento neutro - pattern di continuazione.
* Operare: attendere la direzione del breakout, operare di conseguenza.
12. Triangolo Discendente (Contrattivo) 📐
* Limite inferiore orizzontale (supporto), limite superiore scende.
* Pattern di continuazione ribassista 🔴
* Operare: short alla rottura del supporto con volume.
13. Triangolo Ascendente (Contrattivo) 📐
* Limite superiore orizzontale (resistenza), limite inferiore sale.
* Pattern di continuazione rialzista 🟢
* Operare: long alla rottura della resistenza con volume.
14. Non Valido/Sconosciuto ❌
* Pattern che non soddisfano i criteri geometrici.
* Filtrati automaticamente.
Riepilogo
Key functionalities include identifying potential breakout zones, visualizing market structure through geometric price relationships, and supporting trading of continuation and reversal patterns with visual confirmation. Users can filter detected patterns by trend direction, pivot type, and formation category. The indicator prevents overlapping and duplicate patterns to maintain clarity.
The 14 detected formations cover a range of classical patterns such as ascending, descending, and ranging channels; expanding and contracting wedges; and various triangle types (converging, diverging, ascending, descending). Visual outputs include color-coded boundary lines, pivot numbering, zigzag swing lines, and labeled pattern names for easy interpretation. This tool supports analysis across multiple markets including Forex, stocks, commodities, indices, and cryptocurrencies.
Recensioni dei clienti
5 | 50 % | |
4 | 50 % | |
3 | 0 % | |
2 | 0 % | |
1 | 0 % |


