
Descrizione
Indicatori Pinescriptlabs Store: Pinescriptlabs Store cBots : (cBot) Gold & BTC BreakoutSession Pivots(nuovo)
Proiezione della Liquidità del Prezzo ZigZag
Algoritmo Intelligente di Trailing (nuovo)
Mappa di Liquidazione della Leva
Previsione Basata su Linreg & ATR
Supporto SmartTrend &
Resistenza
Linee
Sistema di Breakout del Canale
Analisi
Dinamica
della Struttura
di Mercato
dei
Punti di Svolta
Regressione
Lineare
Fibonacci
Multi-timeframe
Proiezione del Flusso di Mercato
Gradiente di Tendenza Dinamico
Tracker
Bias Multi-Livello
Candele
Supporto
e Resistenza
Trend
Linee
Tutti i
Livelli di
Supporto e Resistenza
Livelli
Zone di Offerta & Domanda
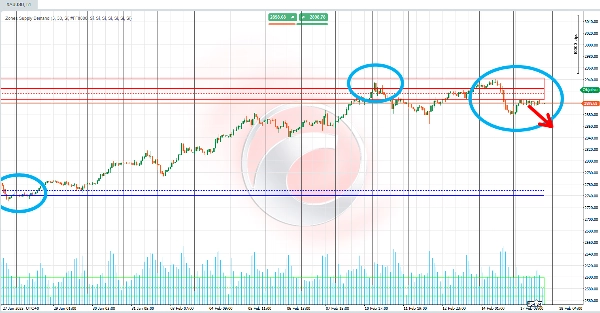
L'algoritmo analizza l'azione del prezzo attraverso l'accumulazione di volume, dividendo l'intervallo di prezzo visibile (dal massimo al minimo) in più segmenti o "intervalli." 📏 Per ogni intervallo, calcola il volume generato e lo confronta con una percentuale soglia predeterminata. L'obiettivo? Identificare livelli dove la concentrazione di volume è così alta da segnalare una Zona di Offerta o Zona di Domanda! 🎯
📉 Per la Zona di Offerta:
- Inizia dal prezzo più alto e scendi attraverso gli intervalli.
- Accumula il volume in ogni segmento.
- Quando il volume accumulato supera la soglia, segna una Zona di Offerta 🚨.
- Una zona colorata (rettangolo con opacità specifica) viene tracciata da questo livello al massimo, insieme a linee orizzontali che mostrano medie semplici e ponderate dei prezzi in questa zona. 🖍️
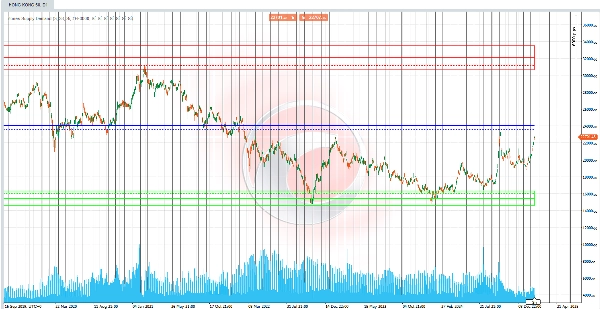
📈 Per la Zona di Domanda:
- Inizia dal prezzo più basso e sali attraverso gli intervalli.
- Accumula il volume in ogni segmento.
- Quando il volume accumulato supera la soglia, definisce una Zona di Domanda 🚨.
- Viene disegnata un'area corrispondente, insieme a linee medie per evidenziare il livello medio di concentrazione. 🖌️
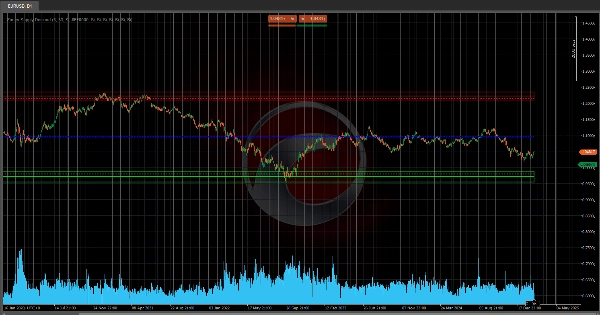
⚖️ Equilibrio di Mercato:
Quando sono identificate sia le Zone di Offerta che di Domanda, l'algoritmo calcola un Punto di Equilibrio di Mercato! 🌟 Questo equilibrio deriva dalla media (semplice o ponderata per volume) tra le due zone. Il risultato? Linee di riferimento chiare sul grafico che mostrano il bilanciamento tra pressione di acquisto e vendita! ⚖️✨
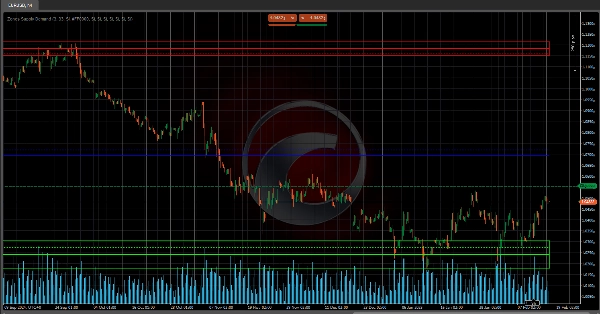
✅ In Sintesi:
L'indicatore "Zone di Offerta & Domanda" utilizza segmentazione del prezzo basata sul volume per rilevare aree chiave di concentrazione degli ordini. 🗝️ Genera quindi segnali visivi (zone colorate, linee medie e punti di equilibrio) per evidenziare livelli critici sul grafico, permettendo ai trader di individuare squilibri tra domanda e offerta e potenziali punti di svolta! 🚀💡
Riepilogo
Recensioni dei clienti
5 | 0 % | |
4 | 50 % | |
3 | 50 % | |
2 | 0 % | |
1 | 0 % |


